Question: The Jacobs Division Richard Soderberg, financial analyst for the Jacobs Division of MacFad- den Chemical Company, was reviewing several complex issues relating to possible investment
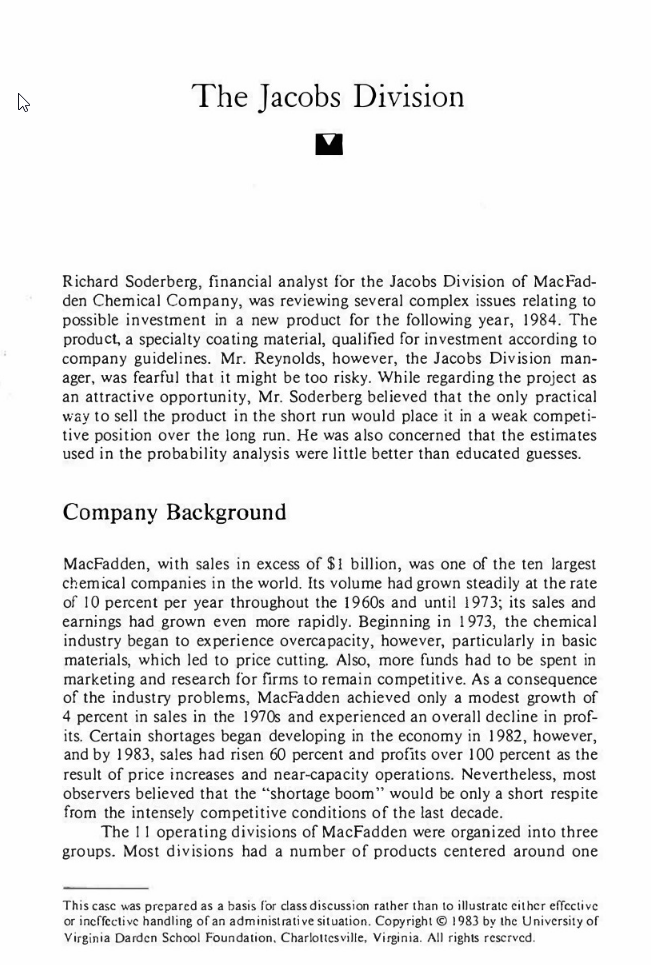
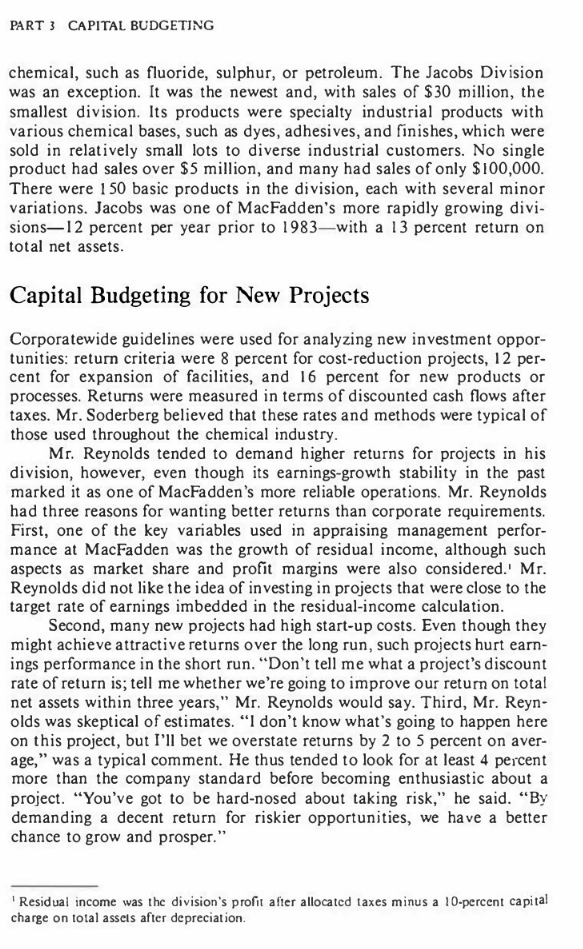
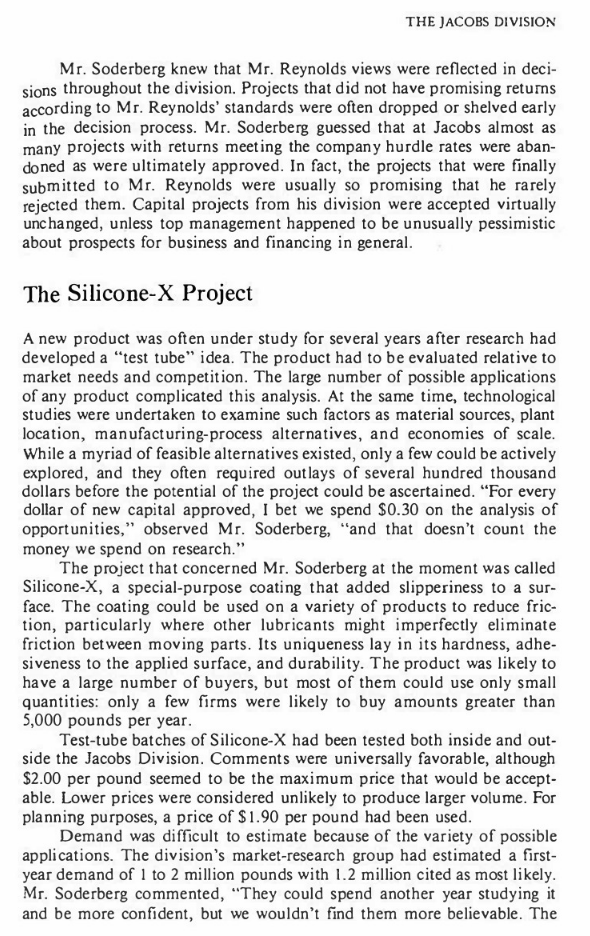
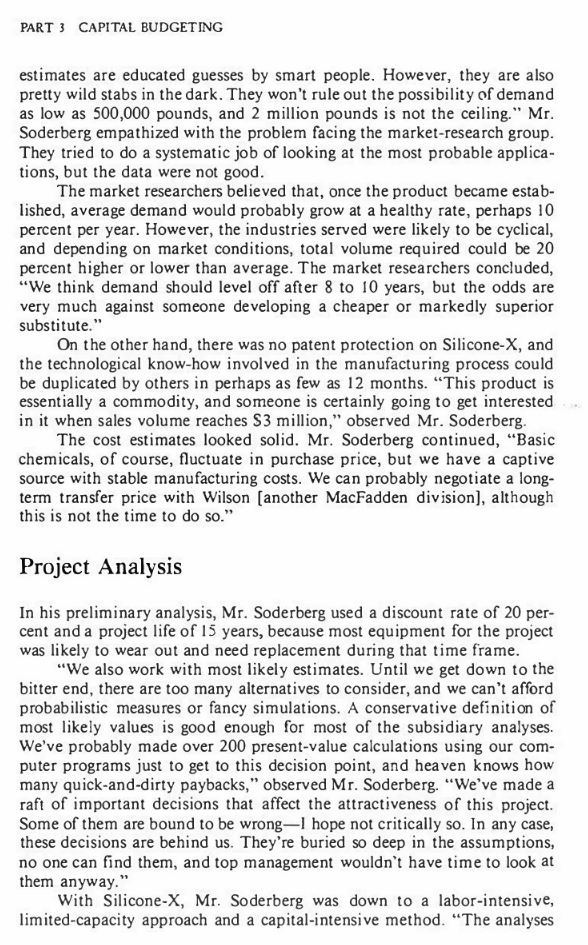
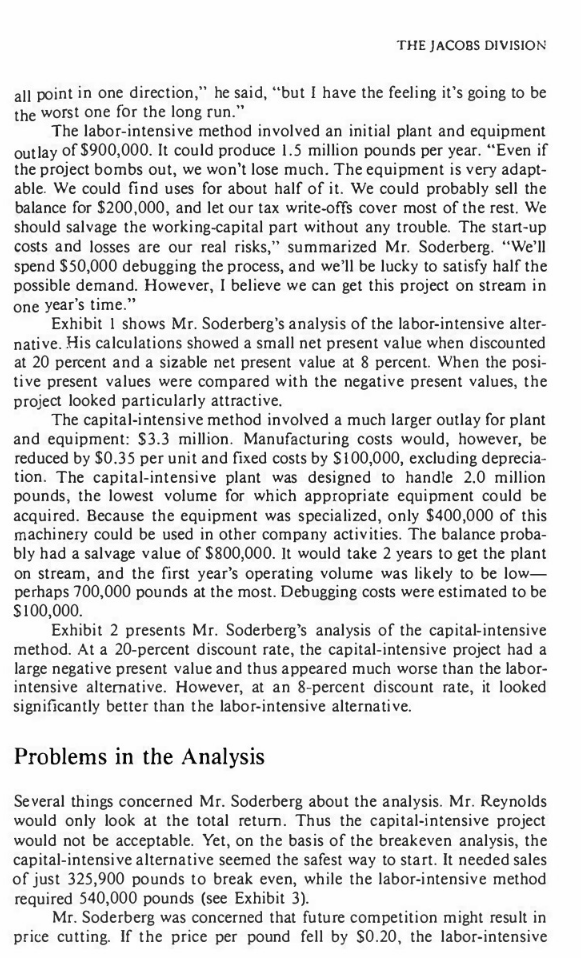
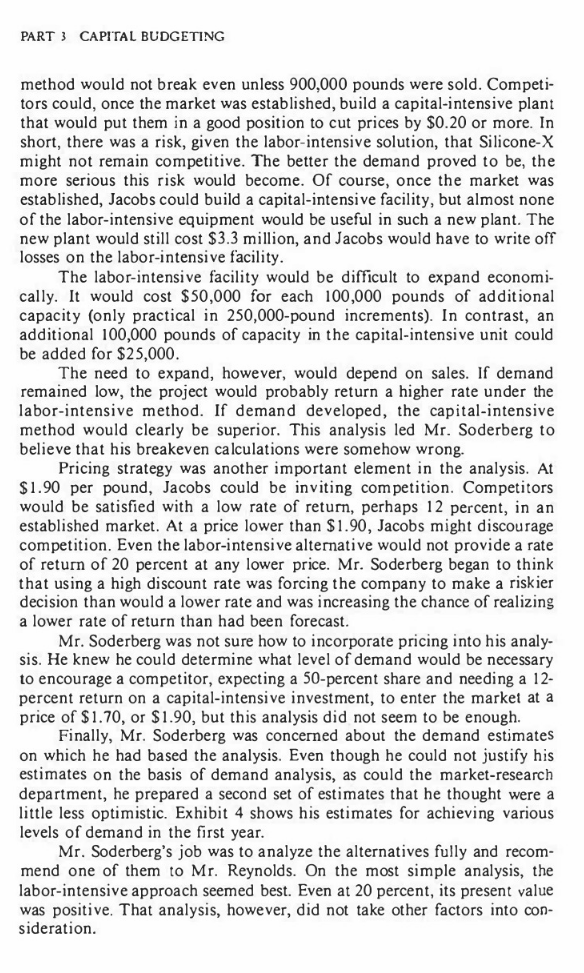
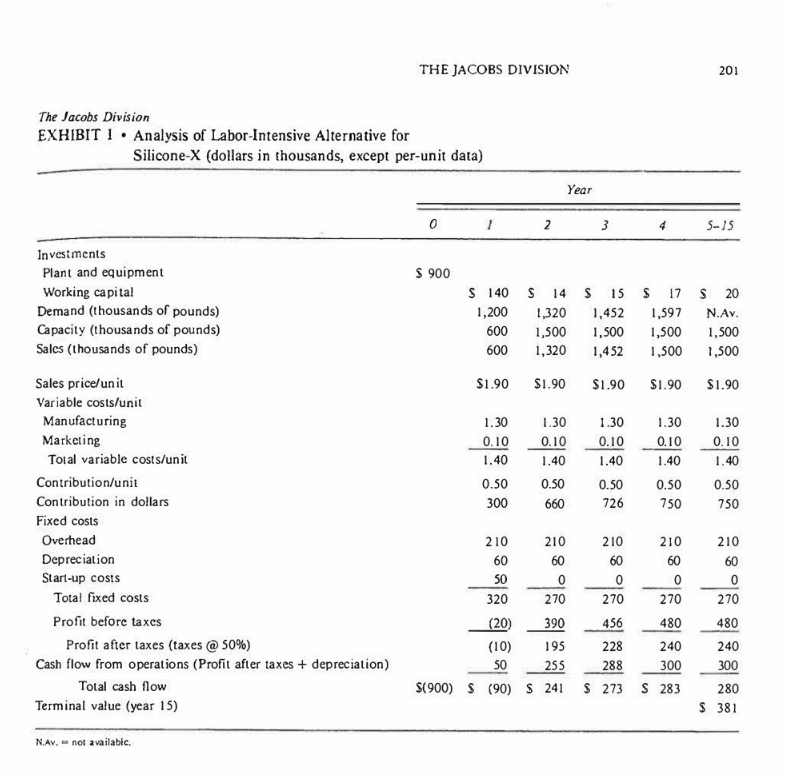
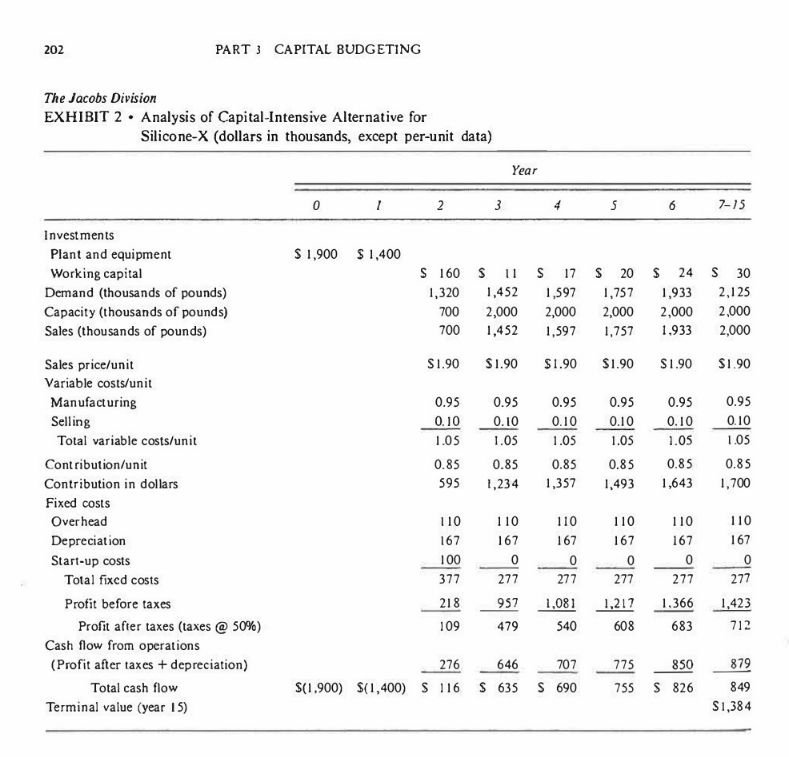
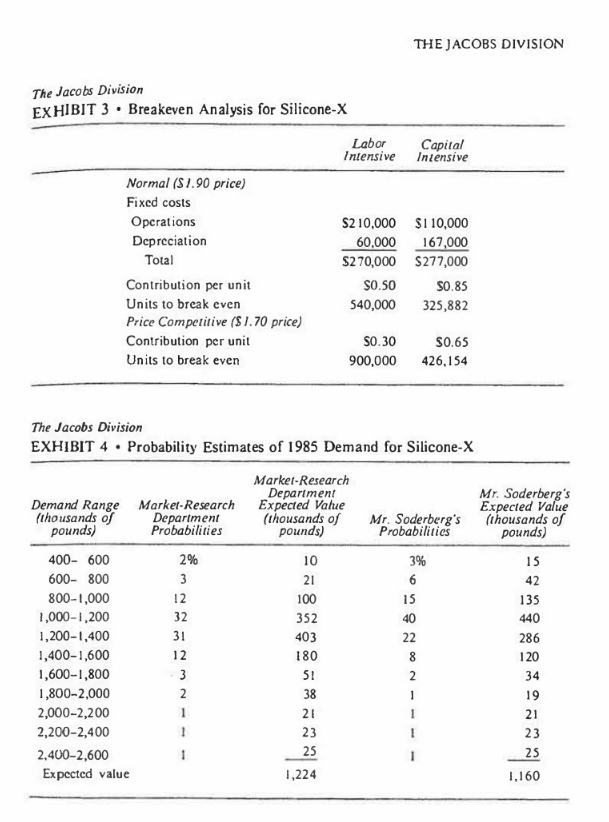

The Jacobs Division Richard Soderberg, financial analyst for the Jacobs Division of MacFad- den Chemical Company, was reviewing several complex issues relating to possible investment in a new product for the following year, 1984. The product, a specialty coating material, qualified for investment according to company guidelines. Mr. Reynolds, however, the Jacobs Division man- ager, was fearful that it might be too risky. While regarding the project as an attractive opportunity, Mr. Soderberg believed that the only practical way to sell the product in the short run would place it in a weak competi- tive position over the long run. He was also concerned that the estimates used in the probability analysis were little better than educated guesses. Company Background MacFadden, with sales in excess of $1 billion, was one of the ten largest chemical companies in the world. Its volume had grown steadily at the rate of 10 percent per year throughout the 1960s and until 1973; its sales and earnings had grown even more rapidly. Beginning in 1973, the chemical industry began to experience overcapacity, however, particularly in basic materials, which led to price cutting. Also, more funds had to be spent in marketing and research for firms to remain competitive. As a consequence of the industry problems, MacFadden achieved only a modest growth of 4 percent in sales in the 1970s and experienced an overall decline in prof- its. Certain shortages began developing in the economy in 1982, however, and by 1983, sales had risen 60 percent and profits over 100 percent as the result of price increases and near-capacity operations. Nevertheless, most observers believed that the shortage boom" would be only a short respite from the intensely competitive conditions of the last decade. The 11 operating divisions of MacFadden were organized into three groups. Most divisions had a number of products centered around one This case was prepared as a basis for class discussion rather than to illustrate cither effective or ineffective handling of an administrative situation. Copyright 1983 by the University of Virginia Darden School Foundation, Charlottesville, Virginia. All rights reserved. PART 3 CAPITAL BUDGETING chemical, such as fluoride, sulphur, or petroleum. The Jacobs Division was an exception. It was the newest and, with sales of $30 million, the smallest division. Its products were specialty industrial products with various chemical bases, such as dyes, adhesives, and finishes, which were sold in relatively small lots to diverse industrial customers. No single product had sales over $5 million, and many had sales of only $100,000. There were 150 basic products in the division, each with several minor variations. Jacobs was one of MacFadden's more rapidly growing divi- sions12 percent per year prior to 1983with a 13 percent return on total net assets. Capital Budgeting for New Projects Corporatewide guidelines were used for analyzing new investment oppor- tunities: return criteria were 8 percent for cost-reduction projects, 12 per- cent for expansion of facilities, and 16 percent for new products or processes. Returns were measured in terms of discounted cash flows after taxes. Mr. Soderberg believed that these rates and methods were typical of those used throughout the chemical industry. Mr. Reynolds tended to demand higher returns for projects in his division, however, even though its earnings-growth stability in the past marked it as one of MacFadden's more reliable operations. Mr. Reynolds had three reasons for wanting better returns than corporate requirements. First, one of the key variables used in appraising management perfor- mance at MacFadden was the growth of residual income, although such aspects as market share and profit margins were also considered.' Mr. Reynolds did not like the idea of investing in projects that were close to the target rate of earnings imbedded in the residual-income calculation. Second, many new projects had high start-up costs. Even though they might achieve attractive returns over the long run, such projects hurt earn- ings performance in the short run. Don't tell me what a project's discount rate of return is; tell me whether we're going to improve our return on total net assets within three years," Mr. Reynolds would say. Third, Mr. Reyn- olds was skeptical of estimates. "I don't know what's going to happen here on this project, but I'll bet we overstate returns by 2 to 5 percent on aver- age," was a typical comment. He thus tended to look for at least 4 percent more than the company standard before becoming enthusiastic about a project. You've got to be hard-nosed about taking risk," he said. By demanding a decent return for riskier opportunities, we have a better chance to grow and prosper." Residual income was the division's profit after allocated taxes minus a 10-percent capital charge on total assets after depreciation. THE JACOBS DIVISION Mr. Soderberg knew that Mr. Reynolds views were reflected in deci- sions throughout the division. Projects that did not have promising returns according to Mr. Reynolds' standards were often dropped or shelved early in the decision process. Mr. Soderberg guessed that at Jacobs almost as many projects with returns meeting the company hurdle rates were aban- doned as were ultimately approved. In fact, the projects that were finally submitted to Mr. Reynolds were usually so promising that he rarely rejected them. Capital projects from his division were accepted virtually unchanged, unless top management happened to be unusually pessimistic about prospects for business and financing in general. The Silicone-X Project A new product was often under study for several years after research had developed a "test tube" idea. The product had to be evaluated relative to market needs and competition. The large number of possible applications of any product complicated this analysis. At the same time, technological studies were undertaken to examine such factors as material sources, plant location, manufacturing process alternatives, and economies of scale. While a myriad of feasible alternatives existed, only a few could be actively explored, and they often required outlays of several hundred thousand dollars before the potential of the project could be ascertained. "For every dollar of new capital approved, I bet we spend $0.30 on the analysis of opportunities," observed Mr. Soderberg, "and that doesn't count the money we spend on research. The project that concerned Mr. Soderberg at the moment was called Silicone-X, a special-purpose coating that added slipperiness to a sur- face. The coating could be used on a variety of products to reduce fric- tion, particularly where other lubricants might imperfectly eliminate friction between moving parts. Its uniqueness lay in its hardness, adhe- siveness to the applied surface, and durability. The product was likely to have a large number of buyers, but most of them could use only small quantities: only a few firms were likely to buy amounts greater than 5,000 pounds per year. Test-tube batches of Silicone-X had been tested both inside and out- side the Jacobs Division. Comments were universally favorable, although $2.00 per pound seemed to be the maximum price that would be accept- able. Lower prices were considered unlikely to produce larger volume. For planning purposes, a price of $1.90 per pound had been used. Demand was difficult to estimate because of the variety of possible applications. The division's market-research group had estimated a first- year demand of 1 to 2 million pounds with 1.2 million cited as most likely. Mr. Soderberg commented, "They could spend another year studying it and be more confident, but we wouldn't find them more believable. The PART 3 CAPITAL BUDGETING estimates are educated guesses by smart people. However, they are also pretty wild stabs in the dark. They won't rule out the possibility of demand as low as 500,000 pounds, and 2 million pounds is not the ceiling." Mr. Soderberg empathized with the problem facing the market research group. They tried to do a systematic job of looking at the most probable applica- tions, but the data were not good. The market researchers believed that, once the product became estab- lished, average demand would probably grow at a healthy rate, perhaps 10 percent per year. However, the industries served were likely to be cyclical, and depending on market conditions, total volume required could be 20 percent higher or lower than average. The market researchers concluded, We think demand should level off after 8 to 10 years, but the odds are very much against someone developing a cheaper or markedly superior substitute." On the other hand, there was no patent protection on Silicone-X, and the technological know-how involved in the manufacturing process could be duplicated by others in perhaps as few as 12 months. This product is essentially a commodity, and someone is certainly going to get interested in it when sales volume reaches S3 million, observed Mr. Soderberg. The cost estimates looked solid. Mr. Soderberg continued, Basic chemicals, of course, fluctuate in purchase price, but we have a captive source with stable manufacturing costs. We can probably negotiate a long- term transfer price with Wilson (another MacFadden division), although this is not the time to do so." Project Analysis In his preliminary analysis, Mr. Soderberg used a discount rate of 20 per- cent and a project life of 15 years, because most equipment for the project was likely to wear out and need replacement during that time frame. "We also work with most likely estimates. Until we get down to the bitter end, there are too many alternatives to consider, and we can't afford probabilistic measures or fancy simulations. A conservative definition of most likely values is good enough for most of the subsidiary analyses. We've probably made over 200 present-value calculations using our com- puter programs just to get to this decision point, and heaven knows how many quick-and-dirty paybacks, observed Mr. Soderberg. We've made a raft of important decisions that affect the attractiveness of this project. Some of them are bound to be wrongI hope not critically so. In any case, these decisions are behind us. They're buried so deep in the assumptions, no one can find them, and top management wouldn't have time to look at them anyway." With Silicone-X, Mr. Soderberg was down to a labor-intensive, limited-capacity approach and a capital-intensive method. The analyses THE JACOBS DIVISION all point in one direction, he said, but I have the feeling it's going to be the worst one for the long run." The labor-intensive method involved an initial plant and equipment out lay of $900,000. It could produce 1.5 million pounds per year. Even if the project bombs out, we won't lose much. The equipment is very adapt- able. We could find uses for about half of it. We could probably sell the balance for $200,000, and let our tax write-offs cover most of the rest. We should salvage the working-capital part without any trouble. The start-up costs and losses are our real risks," summarized Mr. Soderberg. "We'll spend $50,000 debugging the process, and we'll be lucky to satisfy half the possible demand. However, I believe we can get this project on stream in one year's time." Exhibit I shows Mr. Soderberg's analysis of the labor-intensive alter- native. His calculations showed a small net present value when discounted at 20 percent and a sizable net present value at 8 percent. When the posi- tive present values were compared with the negative present values, the project looked particularly attractive, The capital-intensive method involved a much larger outlay for plant and equipment: $3.3 million. Manufacturing costs would, however, be reduced by $0.35 per unit and fixed costs by $100,000, excluding deprecia- tion. The capital-intensive plant was designed to handle 2.0 million pounds, the lowest volume for which appropriate equipment could be acquired. Because the equipment was specialized, only $400,000 of this machinery could be used in other company activities. The balance proba- bly had a salvage value of $800,000. It would take 2 years to get the plant on stream, and the first year's operating volume was likely to be low- perhaps 700,000 pounds at the most. Debugging costs were estimated to be $100,000 Exhibit 2 presents Mr. Soderberg's analysis of the capital-intensive method. At a 20-percent discount rate, the capital-intensive project had a large negative present value and thus appeared much worse than the labor- intensive alternative. However, at an 8-percent discount rate, it looked significantly better than the labor-intensive alternative. Problems in the Analysis Several things concerned Mr. Soderberg about the analysis. Mr. Reynolds would only look at the total retum. Thus the capital-intensive project would not be acceptable. Yet, on the basis of the breakeven analysis, the capital-intensive alternative seemed the safest way to start. It needed sales of just 325,900 pounds to break even, while the labor-intensive method required 540,000 pounds (see Exhibit 3). Mr. Soderberg was concerned that future competition might result in price cutting. If the price per pound fell by $0.20, the labor-intensive PART 3 CAPITAL BUDGETING method would not break even unless 900,000 pounds were sold. Competi- tors could, once the market was established, build a capital-intensive plant that would put them in a good position to cut prices by $0.20 or more. In short, there was a risk, given the labor-intensive solution, that Silicone-X might not remain competitive. The better the demand proved to be, the more serious this risk would become. Of course, once the market was established, Jacobs could build a capital-intensive facility, but almost none of the labor-intensive equipment would be useful in such a new plant. The new plant would still cost $3.3 million, and Jacobs would have to write off losses on the labor-intensive facility. The labor-intensive facility would be difficult to expand economi- cally. It would cost $50,000 for each 100,000 pounds of additional capacity (only practical in 250,000-pound increments). In contrast, an additional 100,000 pounds of capacity in the capital-intensive unit could be added for $25,000. The need to expand, however, would depend on sales. If demand remained low, the project would probably return a higher rate under the labor-intensive method. If demand developed, the capital-intensive method would clearly be superior. This analysis led Mr. Soderberg to believe that his breakeven calculations were somehow wrong. Pricing strategy was another important element in the analysis. At $1.90 per pound, Jacobs could be inviting competition. Competitors would be satisfied with a low rate of return, perhaps 12 percent, in an established market. At a price lower than $1.90, Jacobs might discourage competition. Even the labor-intensive alternative would not provide a rate of return of 20 percent at any lower price. Mr. Soderberg began to think that using a high discount rate was forcing the company to make a riskier decision than would a lower rate and was increasing the chance of realizing a lower rate of return than had been forecast. Mr. Soderberg was not sure how to incorporate pricing into his analy- sis. He knew he could determine what level of demand would be necessary to encourage a competitor, expecting a 50-percent share and needing a 12- percent return on a capital-intensive investment, to enter the market at a price of $1.70, or $1.90, but this analysis did not seem to be enough. Finally, Mr. Soderberg was concerned about the demand estimates on which he had based the analysis. Even though he could not justify his estimates on the basis of demand analysis, as could the market-research department, he prepared a second set of estimates that he thought were a little less optimistic. Exhibit 4 shows his estimates for achieving various levels of demand in the first year. Mr. Soderberg's job was to analyze the alternatives fully and recom- mend one of them to Mr. Reynolds. On the most simple analysis, the labor-intensive approach seemed best. Even at 20 percent, its present value was positive. That analysis, however, did not take other factors into con- sideration. THE JACOBS DIVISION 201 The Jacobs Division EXHIBIT I Analysis of Labor-Intensive Alternative for Silicone-X (dollars in thousands, except per-unit data) Year 0 1 2 3 4 5-15 S 900 S 140 S 14 S 15$ 17 S 20 1,200 1,320 1,452 1,597 N.Av. 600 1,500 1,500 1,500 1,500 600 1,320 1,452 1,500 1,500 $1.90 $1.90 $1.90 $1.90 $1.90 1.30 0.10 1.40 0.50 300 Investments Plant and equipment Working capital Demand (thousands of pounds) Capacity (thousands of pounds) Sales (thousands of pounds) Sales price/unit Variable costs/unit Manufacturing Marketing Total variable costs/unit Contribution/unit Contribution in dollars Fixed costs Overhead Depreciation Start-up costs Total fixed costs Profit before taxes Profit after taxes (taxes @ 50%) Cash flow from operations (Profit after taxes + depreciation) Total cash flow Terminal value (year 15) 1.30 0.10 1.40 0.50 660 1.30 0.10 1.40 1.30 0.10 1.40 1.30 0.10 1.40 0.50 750 0.50 726 0.50 750 210 60 0 270 | 210 210 210 60 60 60 50 0 0 320 270 270 (20) 390 456 (10) 195 228 SO 255 288 S(900) S (90) S 241 S 273 210 60 0 270 480 240 300 480 240 300 280 $ 381 S 283 NAV. -- not available 202 PART 3 CAPITAL BUDGETING The Jacobs Division EXHIBIT 2 Analysis of Capital-Intensive Alternative for Silicone-X (dollars in thousands, except per-unit data) Year 0 1 2 3 4 S 6 7-15 $ 1,900 $1,400 Investments Plant and equipment Working capital Demand (thousands of pounds) Capacity (thousands of pounds) Sales (thousands of pounds) S 160 S S 17 S 20 S 24 S 30 1,320 1,452 1,597 1,757 1,933 2,125 700 2,000 2,000 2,000 2,000 2,000 700 1,452 1,597 1,757 1.933 2,000 S1.90 $1.90 $1.90 $1.90 S1.90 $1.90 0.95 0.10 0.95 0.10 1.05 0.85 1,234 1.05 0.85 595 0.95 0.10 1.05 0.85 1,357 0.95 0.10 1.05 0.85 1,493 0.95 0.10 1.05 0.95 0.10 1.05 0.85 1,700 0.85 1,643 110 Sales price/unit Variable costs/unit Manufacturing Selling Total variable costs/unit Contribution/unit Contribution in dollars Fixed costs Overhead Depreciation Start-up costs Total fixed costs Profit before taxes Profit after taxes (taxes @ 50%) Cash flow from operations (Profit after taxes + depreciation) Total cash flow Terminal value (year 15) 110 167 110 167 100 377 110 167 0 277 167 0 277 110 167 0 277 110 167 0 277 0 277 1,423 218 109 957 479 1,081 540 1,217 608 1.366 683 712 646 707 879 276 $(1.900) $(1,400) S 116 775 850 755 S 826 S 635 S 690 849 $1,384 THE JACOBS DIVISION The Jacobs Division EXHIBIT 3 Breakeven Analysis for Silicone-X Labor Capital Intensive intensive Normal (S/.90 price) Fixed costs Operations Depreciation Total Contribution per unit Units to break even Price Competitive (81.70 price) Contribution per unit Units to break even $210,000 $110,000 60,000 167,000 $270,000 $277,000 $0.50 $0.85 540,000 325,882 SO.30 900,000 S0.65 426,154 The Jacobs Division EXHIBIT 4 . Probability Estimates of 1985 Demand for Silicone-X Mr. Soderberg's Probabilities Mr. Soderberg's Expected Value (thousands of pounds) 3% Demand Range Market-Research (thousands of Department pounds) Probabilities 400-600 2% 600- 800 3 800-1,000 12 1,000-1,200 32 1,200-1,400 31 1,400-1,600 12 1,600--1,800 3 1,800-2,000 2 2,000-2,200 1 2,200-2,400 1 2,400-2,600 Expected value Market Research Department Expected Value (thousands of pounds) 10 21 100 352 403 180 51 38 21 23 25 1,224 6 15 40 22 8 2 1 1 1 1 15 42 135 440 286 120 34 19 21 23 25 1,160 The Jacobs Division 1. If you were Mr. Soderberg, would you recommend that Mr. Reynolds accept the Silicone-X project? If not, why not? 2. How should the effect of competition be taken into account in the decision between the labor- and capital-intensive plants? 3. How should management evaluate the pricing decision and its effect on the Silicone-X capacity investment? 4. From MacFadden management's (the shareholders') point of view, how do you like Mr. Reynolds's method of analyzing investments at the Jacobs Division? The Jacobs Division Richard Soderberg, financial analyst for the Jacobs Division of MacFad- den Chemical Company, was reviewing several complex issues relating to possible investment in a new product for the following year, 1984. The product, a specialty coating material, qualified for investment according to company guidelines. Mr. Reynolds, however, the Jacobs Division man- ager, was fearful that it might be too risky. While regarding the project as an attractive opportunity, Mr. Soderberg believed that the only practical way to sell the product in the short run would place it in a weak competi- tive position over the long run. He was also concerned that the estimates used in the probability analysis were little better than educated guesses. Company Background MacFadden, with sales in excess of $1 billion, was one of the ten largest chemical companies in the world. Its volume had grown steadily at the rate of 10 percent per year throughout the 1960s and until 1973; its sales and earnings had grown even more rapidly. Beginning in 1973, the chemical industry began to experience overcapacity, however, particularly in basic materials, which led to price cutting. Also, more funds had to be spent in marketing and research for firms to remain competitive. As a consequence of the industry problems, MacFadden achieved only a modest growth of 4 percent in sales in the 1970s and experienced an overall decline in prof- its. Certain shortages began developing in the economy in 1982, however, and by 1983, sales had risen 60 percent and profits over 100 percent as the result of price increases and near-capacity operations. Nevertheless, most observers believed that the shortage boom" would be only a short respite from the intensely competitive conditions of the last decade. The 11 operating divisions of MacFadden were organized into three groups. Most divisions had a number of products centered around one This case was prepared as a basis for class discussion rather than to illustrate cither effective or ineffective handling of an administrative situation. Copyright 1983 by the University of Virginia Darden School Foundation, Charlottesville, Virginia. All rights reserved. PART 3 CAPITAL BUDGETING chemical, such as fluoride, sulphur, or petroleum. The Jacobs Division was an exception. It was the newest and, with sales of $30 million, the smallest division. Its products were specialty industrial products with various chemical bases, such as dyes, adhesives, and finishes, which were sold in relatively small lots to diverse industrial customers. No single product had sales over $5 million, and many had sales of only $100,000. There were 150 basic products in the division, each with several minor variations. Jacobs was one of MacFadden's more rapidly growing divi- sions12 percent per year prior to 1983with a 13 percent return on total net assets. Capital Budgeting for New Projects Corporatewide guidelines were used for analyzing new investment oppor- tunities: return criteria were 8 percent for cost-reduction projects, 12 per- cent for expansion of facilities, and 16 percent for new products or processes. Returns were measured in terms of discounted cash flows after taxes. Mr. Soderberg believed that these rates and methods were typical of those used throughout the chemical industry. Mr. Reynolds tended to demand higher returns for projects in his division, however, even though its earnings-growth stability in the past marked it as one of MacFadden's more reliable operations. Mr. Reynolds had three reasons for wanting better returns than corporate requirements. First, one of the key variables used in appraising management perfor- mance at MacFadden was the growth of residual income, although such aspects as market share and profit margins were also considered.' Mr. Reynolds did not like the idea of investing in projects that were close to the target rate of earnings imbedded in the residual-income calculation. Second, many new projects had high start-up costs. Even though they might achieve attractive returns over the long run, such projects hurt earn- ings performance in the short run. Don't tell me what a project's discount rate of return is; tell me whether we're going to improve our return on total net assets within three years," Mr. Reynolds would say. Third, Mr. Reyn- olds was skeptical of estimates. "I don't know what's going to happen here on this project, but I'll bet we overstate returns by 2 to 5 percent on aver- age," was a typical comment. He thus tended to look for at least 4 percent more than the company standard before becoming enthusiastic about a project. You've got to be hard-nosed about taking risk," he said. By demanding a decent return for riskier opportunities, we have a better chance to grow and prosper." Residual income was the division's profit after allocated taxes minus a 10-percent capital charge on total assets after depreciation. THE JACOBS DIVISION Mr. Soderberg knew that Mr. Reynolds views were reflected in deci- sions throughout the division. Projects that did not have promising returns according to Mr. Reynolds' standards were often dropped or shelved early in the decision process. Mr. Soderberg guessed that at Jacobs almost as many projects with returns meeting the company hurdle rates were aban- doned as were ultimately approved. In fact, the projects that were finally submitted to Mr. Reynolds were usually so promising that he rarely rejected them. Capital projects from his division were accepted virtually unchanged, unless top management happened to be unusually pessimistic about prospects for business and financing in general. The Silicone-X Project A new product was often under study for several years after research had developed a "test tube" idea. The product had to be evaluated relative to market needs and competition. The large number of possible applications of any product complicated this analysis. At the same time, technological studies were undertaken to examine such factors as material sources, plant location, manufacturing process alternatives, and economies of scale. While a myriad of feasible alternatives existed, only a few could be actively explored, and they often required outlays of several hundred thousand dollars before the potential of the project could be ascertained. "For every dollar of new capital approved, I bet we spend $0.30 on the analysis of opportunities," observed Mr. Soderberg, "and that doesn't count the money we spend on research. The project that concerned Mr. Soderberg at the moment was called Silicone-X, a special-purpose coating that added slipperiness to a sur- face. The coating could be used on a variety of products to reduce fric- tion, particularly where other lubricants might imperfectly eliminate friction between moving parts. Its uniqueness lay in its hardness, adhe- siveness to the applied surface, and durability. The product was likely to have a large number of buyers, but most of them could use only small quantities: only a few firms were likely to buy amounts greater than 5,000 pounds per year. Test-tube batches of Silicone-X had been tested both inside and out- side the Jacobs Division. Comments were universally favorable, although $2.00 per pound seemed to be the maximum price that would be accept- able. Lower prices were considered unlikely to produce larger volume. For planning purposes, a price of $1.90 per pound had been used. Demand was difficult to estimate because of the variety of possible applications. The division's market-research group had estimated a first- year demand of 1 to 2 million pounds with 1.2 million cited as most likely. Mr. Soderberg commented, "They could spend another year studying it and be more confident, but we wouldn't find them more believable. The PART 3 CAPITAL BUDGETING estimates are educated guesses by smart people. However, they are also pretty wild stabs in the dark. They won't rule out the possibility of demand as low as 500,000 pounds, and 2 million pounds is not the ceiling." Mr. Soderberg empathized with the problem facing the market research group. They tried to do a systematic job of looking at the most probable applica- tions, but the data were not good. The market researchers believed that, once the product became estab- lished, average demand would probably grow at a healthy rate, perhaps 10 percent per year. However, the industries served were likely to be cyclical, and depending on market conditions, total volume required could be 20 percent higher or lower than average. The market researchers concluded, We think demand should level off after 8 to 10 years, but the odds are very much against someone developing a cheaper or markedly superior substitute." On the other hand, there was no patent protection on Silicone-X, and the technological know-how involved in the manufacturing process could be duplicated by others in perhaps as few as 12 months. This product is essentially a commodity, and someone is certainly going to get interested in it when sales volume reaches S3 million, observed Mr. Soderberg. The cost estimates looked solid. Mr. Soderberg continued, Basic chemicals, of course, fluctuate in purchase price, but we have a captive source with stable manufacturing costs. We can probably negotiate a long- term transfer price with Wilson (another MacFadden division), although this is not the time to do so." Project Analysis In his preliminary analysis, Mr. Soderberg used a discount rate of 20 per- cent and a project life of 15 years, because most equipment for the project was likely to wear out and need replacement during that time frame. "We also work with most likely estimates. Until we get down to the bitter end, there are too many alternatives to consider, and we can't afford probabilistic measures or fancy simulations. A conservative definition of most likely values is good enough for most of the subsidiary analyses. We've probably made over 200 present-value calculations using our com- puter programs just to get to this decision point, and heaven knows how many quick-and-dirty paybacks, observed Mr. Soderberg. We've made a raft of important decisions that affect the attractiveness of this project. Some of them are bound to be wrongI hope not critically so. In any case, these decisions are behind us. They're buried so deep in the assumptions, no one can find them, and top management wouldn't have time to look at them anyway." With Silicone-X, Mr. Soderberg was down to a labor-intensive, limited-capacity approach and a capital-intensive method. The analyses THE JACOBS DIVISION all point in one direction, he said, but I have the feeling it's going to be the worst one for the long run." The labor-intensive method involved an initial plant and equipment out lay of $900,000. It could produce 1.5 million pounds per year. Even if the project bombs out, we won't lose much. The equipment is very adapt- able. We could find uses for about half of it. We could probably sell the balance for $200,000, and let our tax write-offs cover most of the rest. We should salvage the working-capital part without any trouble. The start-up costs and losses are our real risks," summarized Mr. Soderberg. "We'll spend $50,000 debugging the process, and we'll be lucky to satisfy half the possible demand. However, I believe we can get this project on stream in one year's time." Exhibit I shows Mr. Soderberg's analysis of the labor-intensive alter- native. His calculations showed a small net present value when discounted at 20 percent and a sizable net present value at 8 percent. When the posi- tive present values were compared with the negative present values, the project looked particularly attractive, The capital-intensive method involved a much larger outlay for plant and equipment: $3.3 million. Manufacturing costs would, however, be reduced by $0.35 per unit and fixed costs by $100,000, excluding deprecia- tion. The capital-intensive plant was designed to handle 2.0 million pounds, the lowest volume for which appropriate equipment could be acquired. Because the equipment was specialized, only $400,000 of this machinery could be used in other company activities. The balance proba- bly had a salvage value of $800,000. It would take 2 years to get the plant on stream, and the first year's operating volume was likely to be low- perhaps 700,000 pounds at the most. Debugging costs were estimated to be $100,000 Exhibit 2 presents Mr. Soderberg's analysis of the capital-intensive method. At a 20-percent discount rate, the capital-intensive project had a large negative present value and thus appeared much worse than the labor- intensive alternative. However, at an 8-percent discount rate, it looked significantly better than the labor-intensive alternative. Problems in the Analysis Several things concerned Mr. Soderberg about the analysis. Mr. Reynolds would only look at the total retum. Thus the capital-intensive project would not be acceptable. Yet, on the basis of the breakeven analysis, the capital-intensive alternative seemed the safest way to start. It needed sales of just 325,900 pounds to break even, while the labor-intensive method required 540,000 pounds (see Exhibit 3). Mr. Soderberg was concerned that future competition might result in price cutting. If the price per pound fell by $0.20, the labor-intensive PART 3 CAPITAL BUDGETING method would not break even unless 900,000 pounds were sold. Competi- tors could, once the market was established, build a capital-intensive plant that would put them in a good position to cut prices by $0.20 or more. In short, there was a risk, given the labor-intensive solution, that Silicone-X might not remain competitive. The better the demand proved to be, the more serious this risk would become. Of course, once the market was established, Jacobs could build a capital-intensive facility, but almost none of the labor-intensive equipment would be useful in such a new plant. The new plant would still cost $3.3 million, and Jacobs would have to write off losses on the labor-intensive facility. The labor-intensive facility would be difficult to expand economi- cally. It would cost $50,000 for each 100,000 pounds of additional capacity (only practical in 250,000-pound increments). In contrast, an additional 100,000 pounds of capacity in the capital-intensive unit could be added for $25,000. The need to expand, however, would depend on sales. If demand remained low, the project would probably return a higher rate under the labor-intensive method. If demand developed, the capital-intensive method would clearly be superior. This analysis led Mr. Soderberg to believe that his breakeven calculations were somehow wrong. Pricing strategy was another important element in the analysis. At $1.90 per pound, Jacobs could be inviting competition. Competitors would be satisfied with a low rate of return, perhaps 12 percent, in an established market. At a price lower than $1.90, Jacobs might discourage competition. Even the labor-intensive alternative would not provide a rate of return of 20 percent at any lower price. Mr. Soderberg began to think that using a high discount rate was forcing the company to make a riskier decision than would a lower rate and was increasing the chance of realizing a lower rate of return than had been forecast. Mr. Soderberg was not sure how to incorporate pricing into his analy- sis. He knew he could determine what level of demand would be necessary to encourage a competitor, expecting a 50-percent share and needing a 12- percent return on a capital-intensive investment, to enter the market at a price of $1.70, or $1.90, but this analysis did not seem to be enough. Finally, Mr. Soderberg was concerned about the demand estimates on which he had based the analysis. Even though he could not justify his estimates on the basis of demand analysis, as could the market-research department, he prepared a second set of estimates that he thought were a little less optimistic. Exhibit 4 shows his estimates for achieving various levels of demand in the first year. Mr. Soderberg's job was to analyze the alternatives fully and recom- mend one of them to Mr. Reynolds. On the most simple analysis, the labor-intensive approach seemed best. Even at 20 percent, its present value was positive. That analysis, however, did not take other factors into con- sideration. THE JACOBS DIVISION 201 The Jacobs Division EXHIBIT I Analysis of Labor-Intensive Alternative for Silicone-X (dollars in thousands, except per-unit data) Year 0 1 2 3 4 5-15 S 900 S 140 S 14 S 15$ 17 S 20 1,200 1,320 1,452 1,597 N.Av. 600 1,500 1,500 1,500 1,500 600 1,320 1,452 1,500 1,500 $1.90 $1.90 $1.90 $1.90 $1.90 1.30 0.10 1.40 0.50 300 Investments Plant and equipment Working capital Demand (thousands of pounds) Capacity (thousands of pounds) Sales (thousands of pounds) Sales price/unit Variable costs/unit Manufacturing Marketing Total variable costs/unit Contribution/unit Contribution in dollars Fixed costs Overhead Depreciation Start-up costs Total fixed costs Profit before taxes Profit after taxes (taxes @ 50%) Cash flow from operations (Profit after taxes + depreciation) Total cash flow Terminal value (year 15) 1.30 0.10 1.40 0.50 660 1.30 0.10 1.40 1.30 0.10 1.40 1.30 0.10 1.40 0.50 750 0.50 726 0.50 750 210 60 0 270 | 210 210 210 60 60 60 50 0 0 320 270 270 (20) 390 456 (10) 195 228 SO 255 288 S(900) S (90) S 241 S 273 210 60 0 270 480 240 300 480 240 300 280 $ 381 S 283 NAV. -- not available 202 PART 3 CAPITAL BUDGETING The Jacobs Division EXHIBIT 2 Analysis of Capital-Intensive Alternative for Silicone-X (dollars in thousands, except per-unit data) Year 0 1 2 3 4 S 6 7-15 $ 1,900 $1,400 Investments Plant and equipment Working capital Demand (thousands of pounds) Capacity (thousands of pounds) Sales (thousands of pounds) S 160 S S 17 S 20 S 24 S 30 1,320 1,452 1,597 1,757 1,933 2,125 700 2,000 2,000 2,000 2,000 2,000 700 1,452 1,597 1,757 1.933 2,000 S1.90 $1.90 $1.90 $1.90 S1.90 $1.90 0.95 0.10 0.95 0.10 1.05 0.85 1,234 1.05 0.85 595 0.95 0.10 1.05 0.85 1,357 0.95 0.10 1.05 0.85 1,493 0.95 0.10 1.05 0.95 0.10 1.05 0.85 1,700 0.85 1,643 110 Sales price/unit Variable costs/unit Manufacturing Selling Total variable costs/unit Contribution/unit Contribution in dollars Fixed costs Overhead Depreciation Start-up costs Total fixed costs Profit before taxes Profit after taxes (taxes @ 50%) Cash flow from operations (Profit after taxes + depreciation) Total cash flow Terminal value (year 15) 110 167 110 167 100 377 110 167 0 277 167 0 277 110 167 0 277 110 167 0 277 0 277 1,423 218 109 957 479 1,081 540 1,217 608 1.366 683 712 646 707 879 276 $(1.900) $(1,400) S 116 775 850 755 S 826 S 635 S 690 849 $1,384 THE JACOBS DIVISION The Jacobs Division EXHIBIT 3 Breakeven Analysis for Silicone-X Labor Capital Intensive intensive Normal (S/.90 price) Fixed costs Operations Depreciation Total Contribution per unit Units to break even Price Competitive (81.70 price) Contribution per unit Units to break even $210,000 $110,000 60,000 167,000 $270,000 $277,000 $0.50 $0.85 540,000 325,882 SO.30 900,000 S0.65 426,154 The Jacobs Division EXHIBIT 4 . Probability Estimates of 1985 Demand for Silicone-X Mr. Soderberg's Probabilities Mr. Soderberg's Expected Value (thousands of pounds) 3% Demand Range Market-Research (thousands of Department pounds) Probabilities 400-600 2% 600- 800 3 800-1,000 12 1,000-1,200 32 1,200-1,400 31 1,400-1,600 12 1,600--1,800 3 1,800-2,000 2 2,000-2,200 1 2,200-2,400 1 2,400-2,600 Expected value Market Research Department Expected Value (thousands of pounds) 10 21 100 352 403 180 51 38 21 23 25 1,224 6 15 40 22 8 2 1 1 1 1 15 42 135 440 286 120 34 19 21 23 25 1,160 The Jacobs Division 1. If you were Mr. Soderberg, would you recommend that Mr. Reynolds accept the Silicone-X project? If not, why not? 2. How should the effect of competition be taken into account in the decision between the labor- and capital-intensive plants? 3. How should management evaluate the pricing decision and its effect on the Silicone-X capacity investment? 4. From MacFadden management's (the shareholders') point of view, how do you like Mr. Reynolds's method of analyzing investments at the Jacobs Division
Step by Step Solution
There are 3 Steps involved in it

Get step-by-step solutions from verified subject matter experts


