Question
The length of 40 leaves of a plant measured correct to one millimetre and the obtained data is represented in the following table (i) Draw
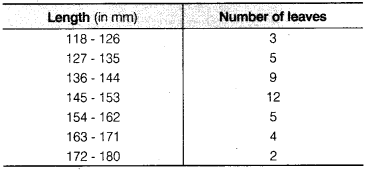
The length of 40 leaves of a plant measured correct to one millimetre and the obtained data is represented in the following table (i) Draw a histogram to represent the given data.(ii) Is there any other suitable graphical representation for the same data?(iii) Is it correct to conclude that the maximum number of leaves 153 mm long and Why?
Length (in mm) 118-126 127-135 136-144 145-153 154 - 162 163-171 172-180 Number of leaves NAVN or w 12
Step by Step Solution
3.40 Rating (153 Votes )
There are 3 Steps involved in it
Step: 1
The detailed answer for the above question is provided below Solution i The given frequency distr...
Get Instant Access to Expert-Tailored Solutions
See step-by-step solutions with expert insights and AI powered tools for academic success
Step: 2

Step: 3

Ace Your Homework with AI
Get the answers you need in no time with our AI-driven, step-by-step assistance
Get StartedRecommended Textbook for
Business Statistics In Practice
Authors: Bruce Bowerman, Richard O'Connell
6th Edition
0073401838, 978-0073401836
Students also viewed these Mathematics questions
Question
Answered: 1 week ago
Question
Answered: 1 week ago
Question
Answered: 1 week ago
Question
Answered: 1 week ago
Question
Answered: 1 week ago
Question
Answered: 1 week ago
Question
Answered: 1 week ago
Question
Answered: 1 week ago
Question
Answered: 1 week ago
Question
Answered: 1 week ago
Question
Answered: 1 week ago
Question
Answered: 1 week ago
Question
Answered: 1 week ago
Question
Answered: 1 week ago
Question
Answered: 1 week ago
Question
Answered: 1 week ago
Question
Answered: 1 week ago
Question
Answered: 1 week ago
Question
Answered: 1 week ago
Question
Answered: 1 week ago
Question
Answered: 1 week ago
View Answer in SolutionInn App


