Answered step by step
Verified Expert Solution
Question
1 Approved Answer
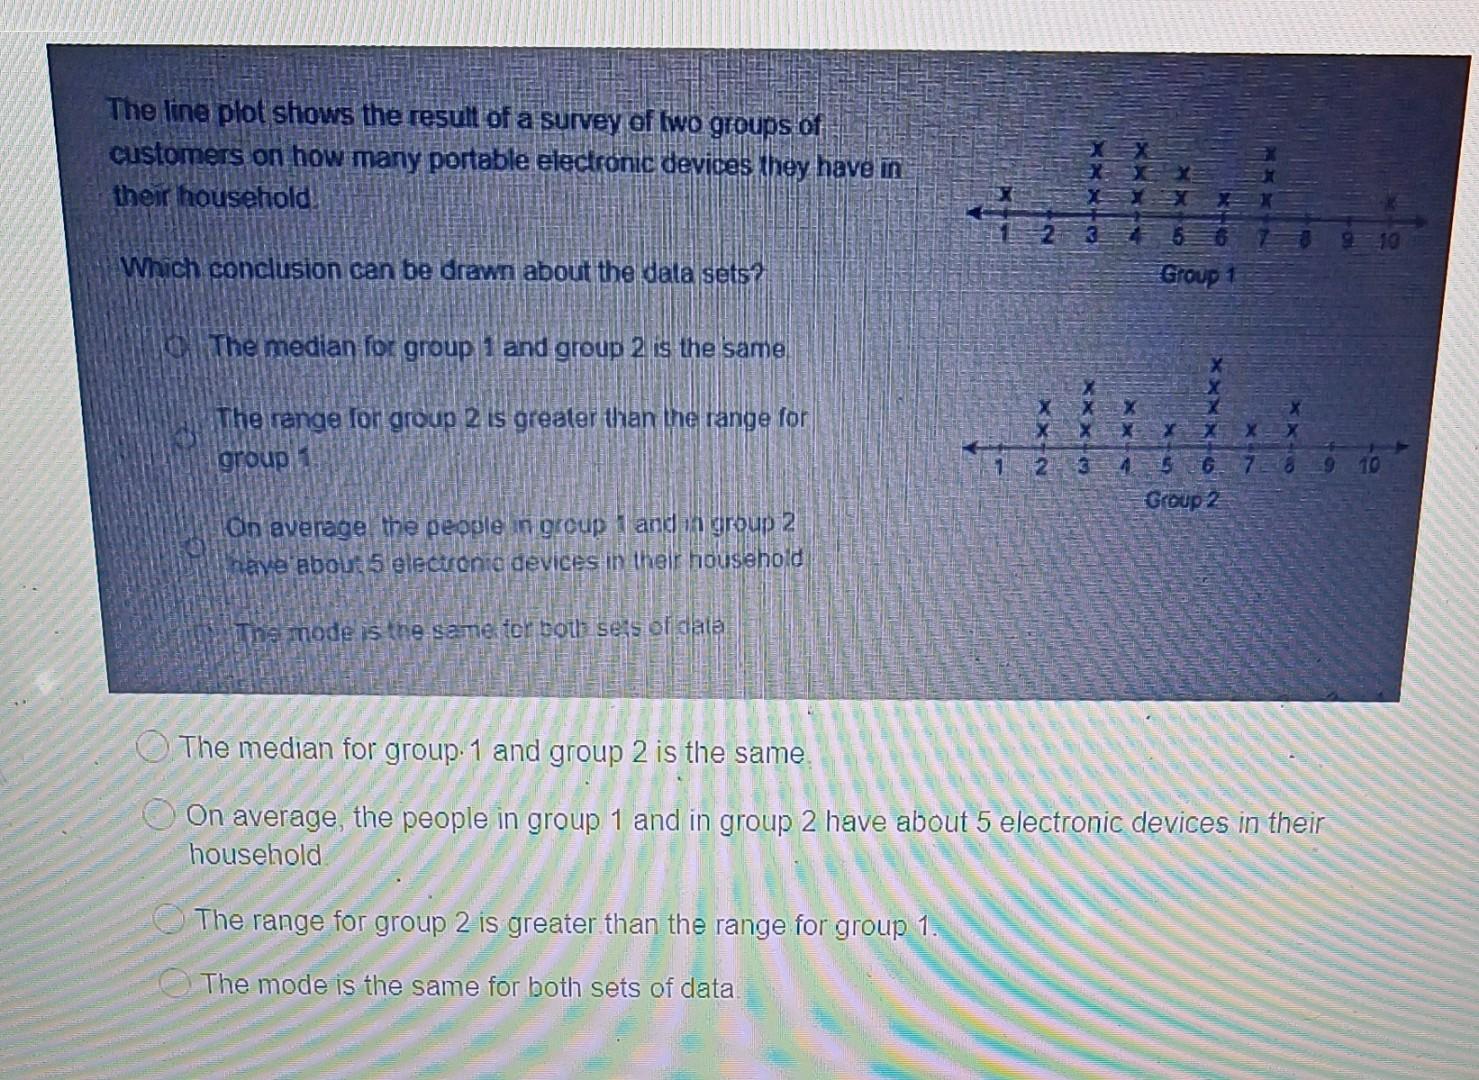
The line plot shows the result of a survey of two groups of customers on how many portable electronic devices they have in their


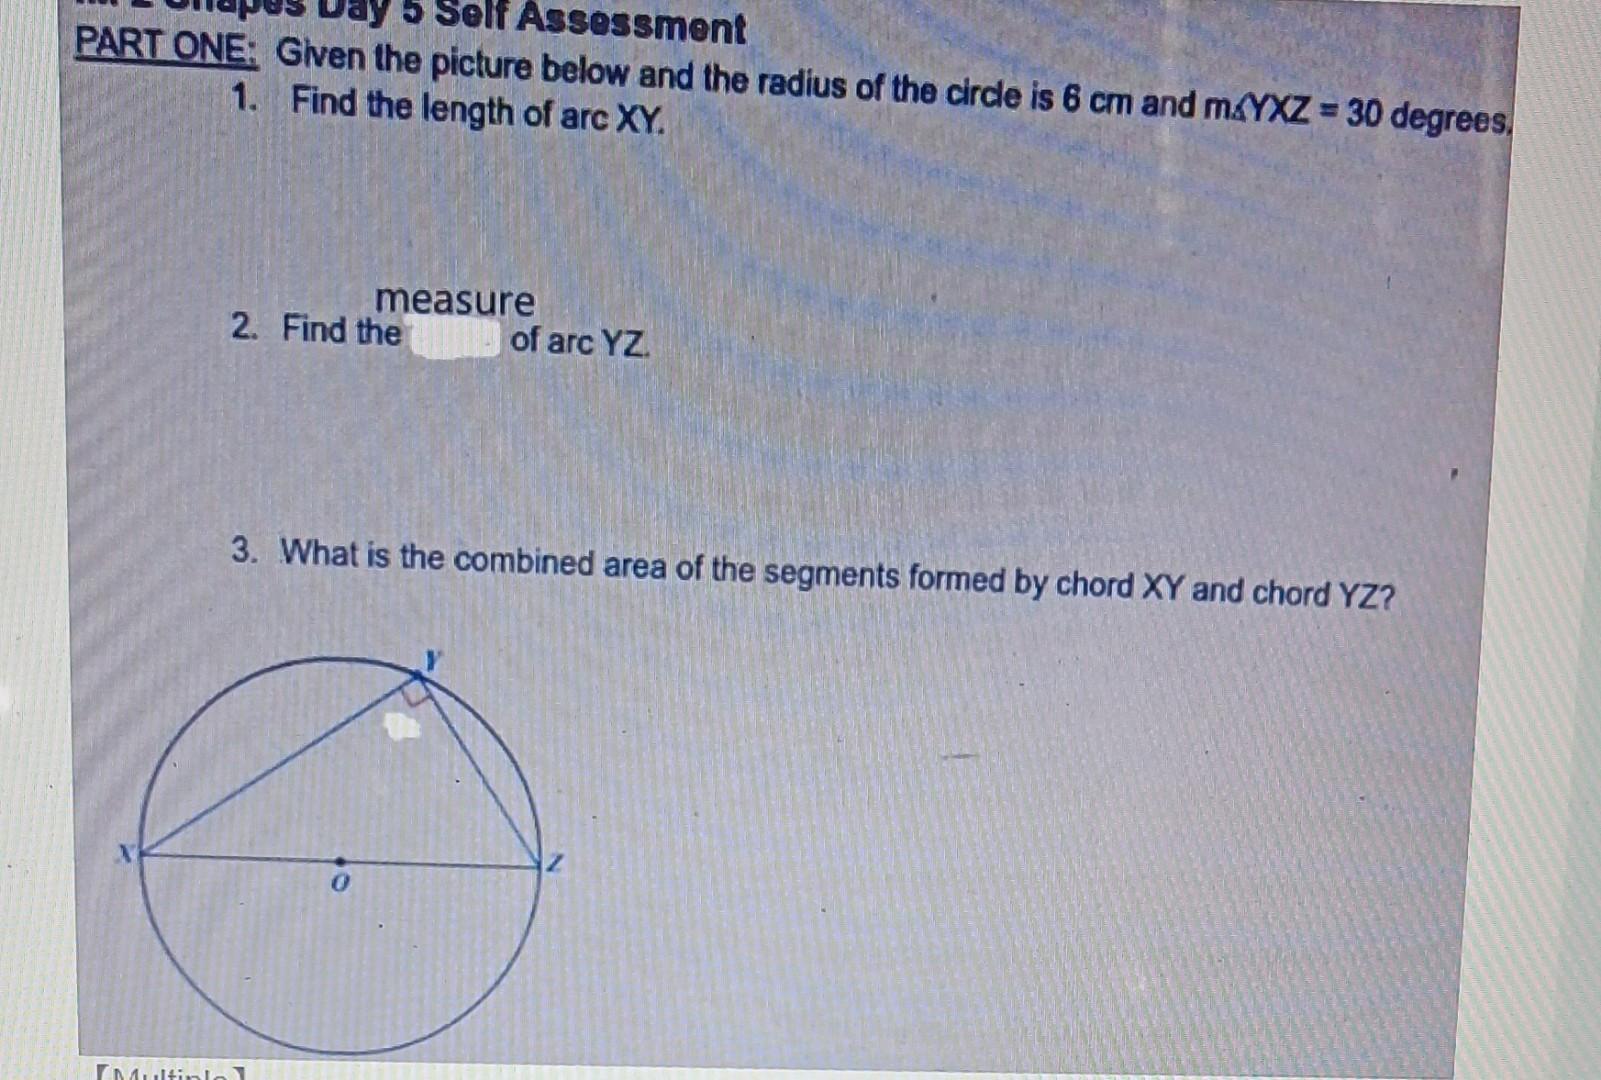
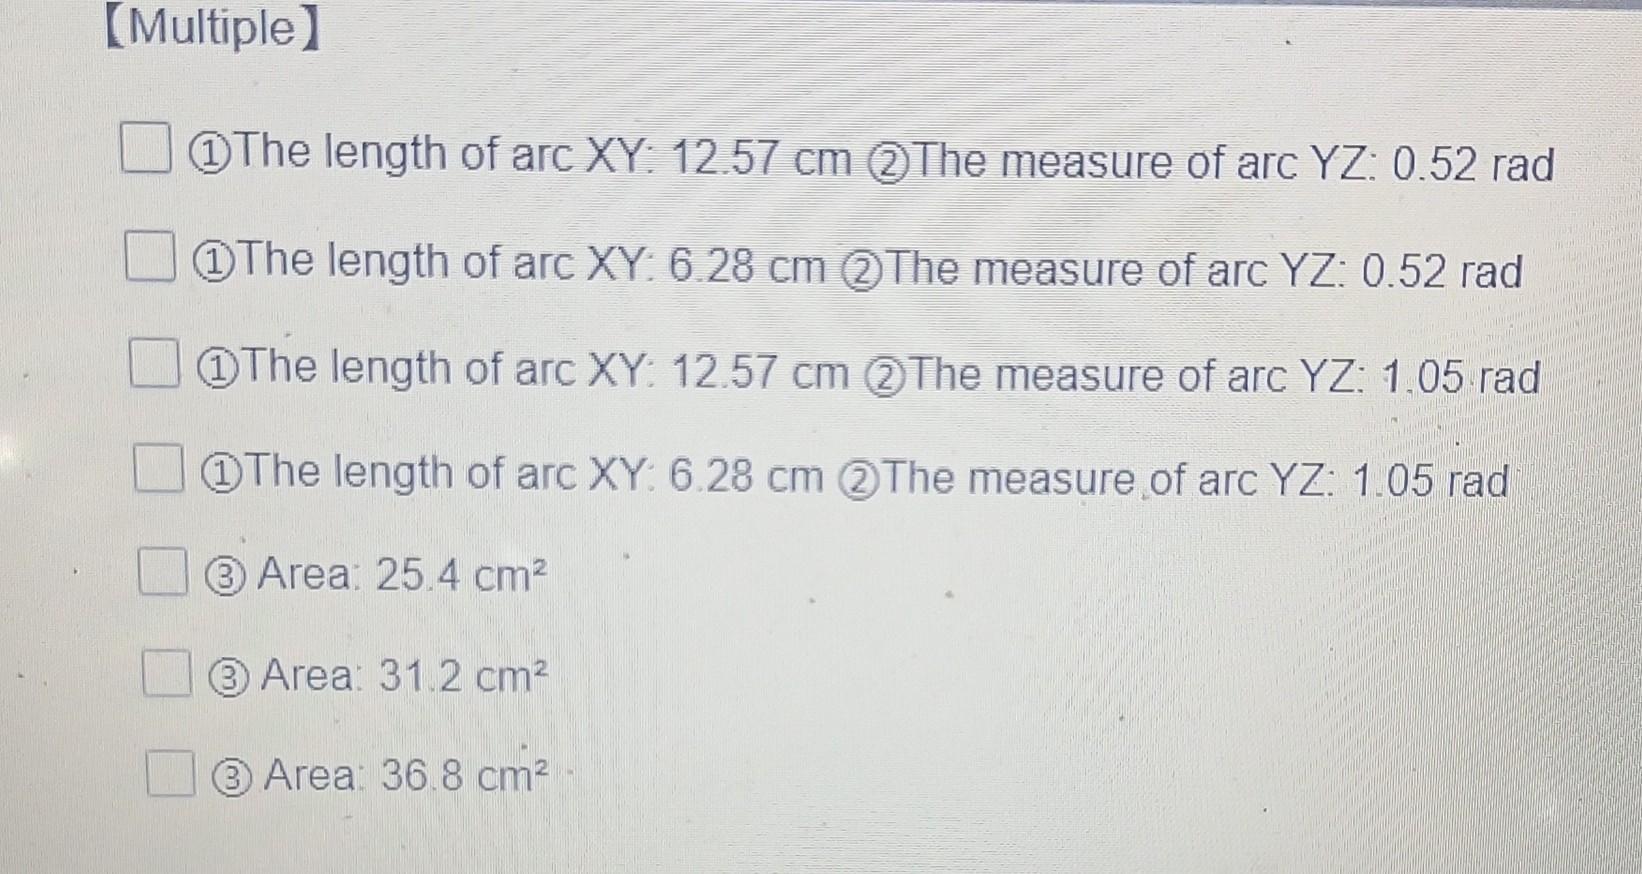
The line plot shows the result of a survey of two groups of customers on how many portable electronic devices they have in their household! Which conclusion can be drawn about the data sets? The median for group 1 and group 2 is the same The range for group 2 is greater than the range for group 1 On average the people in group 1 and in group 2 have about 5 electronic devices in their household The mode is the same for both sets of data 4. Group 1 The range for group 2 is greater than the range for group 1. The mode is the same for both sets of data. X XXXXX X-X The median for group. 1 and group 2 is the same On average, the people in group 1 and in group 2 have about 5 electronic devices in their household 10 234 5678 9 10 Group 2 Self Assessment PART ONE: Given the picture below and the radius of the circle is 6 cm and mYXZ = 30 degrees. 1. Find the length of arc XY. Multipla measure 2. Find the of arc YZ. 3. What is the combined area of the segments formed by chord XY and chord YZ? [Multiple] The length of arc XY: 12.57 cm 2The measure of arc YZ: 0.52 rad The length of arc XY: 6.28 cm 2The measure of arc YZ: 0.52 rad The length of arc XY: 12.57 cm @The measure of arc YZ: 1.05 rad The length of arc XY: 6.28 cm @The measure of arc YZ: 1.05 rad 3 Area: 25.4 cm (3) Area: 31.2 cm 3 Area: 36.8 cm
Step by Step Solution
★★★★★
3.46 Rating (149 Votes )
There are 3 Steps involved in it
Step: 1
SOLUTION Let ...
Get Instant Access to Expert-Tailored Solutions
See step-by-step solutions with expert insights and AI powered tools for academic success
Step: 2

Step: 3

Ace Your Homework with AI
Get the answers you need in no time with our AI-driven, step-by-step assistance
Get Started


