

Question
The link to the Excel File: https://we.tl/foGop3ldJ0 *Note - I did not do these calculations, I just need to be able to summarize and analyze
The link to the Excel File: https://we.tl/foGop3ldJ0
*Note - I did not do these calculations, I just need to be able to summarize and analyze the information given... It is possible that my teammate made mistakes, but I need to be able to submit something anyway.
I need to write a summary of the following capital budgeting analysis. You may wish to include a table or graph to explain the data and results of the analysis. Information provided is below. Any support on how to analyze and explain the data would be helpful.
Capital Budgeting Problem Parameters:
Consider the following expansion capital budgeting problem.
A capital budgeting decision is being considered that would involve an expansion and simultaneous replacement of old equipment.
The project is expected to have a 6 year life for the firm. This project will replace some existing equipment which currently has a book value (BV) of $200k and an estimated market salvage value of $375k. The new project will require new equipment costing $2000k, which will be depreciated straight-line to a book value of $200k at the end of 6 years. Due to new energy efficient technology, replacing the old equipment with the new more efficient equipment will generate an immediate tax credit of 5% of the equipment's cost. The expansion will require an additional investment in NWC of $200k.
Sales are expected to increase by $1000k the first year and grow by 15% in years 2 and 3, then by 5% annually during the remaining 6 year life. Cost of goods sold is forecasted to be 45% of the increased sales, and other selling and general administrative expenses are forecasted to be 10% of the increased sales. It is forecasted that the new equipment will have a salvage value of $300k at the end of the project's 6 year life.
The firm's weighted average cost of capital (WACC) for projects of this risk level is 8%. The firm's marginal tax rate is T = 40%. Use the Excel template to complete the capital budgeting analysis. Your Excel analysis should clearly indicate the cash flow analysis timeline and should provide the project's NPV, IRR, PBP, PI, and also illustrate the project's NPV Profile.
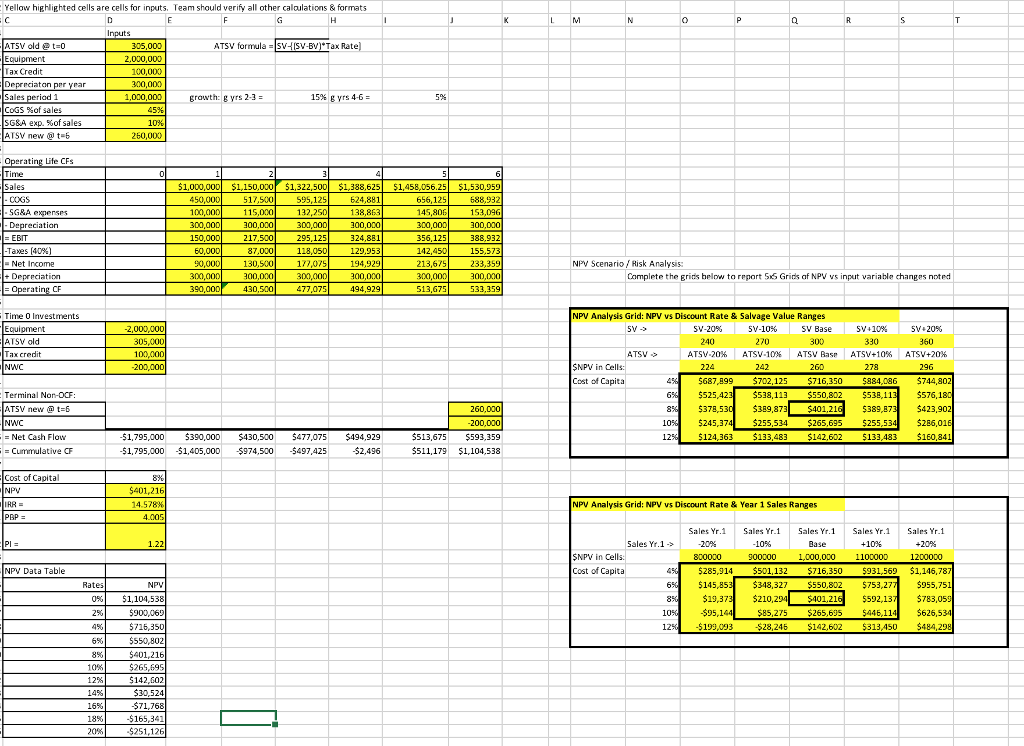
ellow highlighted cells are cells for inputs Team should verify all other caloulations & formats vM ATSV formula = SV.HSV.BV*Tax Rate ATSV oldt-0 Equipment 305,000 2,000,000 100,000 00,000 Sales 1,000,00 grawth: g vrs 2-3 15% g yrs 4-6 = %of sales SG&A exp. %of sales 10% 260,000 rating Life CFs $1,000,00D$1,150,000 1,322,500$1,388,625 1,458,056.25 1.530.959 COGS 450,000 100,000 300,000 150,000 60,000 50,000 300,000 390,000 132,250 300,000 145,806 300,000 00,000 EBIT 324,881 129.953 388,932 37,000 118,050 Net Ircome NPV ScenarioRisk Analysis 00,020 430,500 300,000 513,675 Complete the grids below to report 5x5 Grids af NPV vs input variable changes noted 477,075 494,929 33,359 Time 0 Investments NPV Analysis Grid: NPV vs Discount Rate & Salvage Value Ranges Equipment 2,000 SV-20% SV-1056 SV Base Sy,10% SV+20% Credit ATSV ATSV-2096 ATSV-1096 ATSV Ras" ATSV4-1056 ATSV+2096 SNPV Cost of 224 $687,899 $702,125 $716,350 $884,086 $744,802 $525,42 5378,53 $245,37 $124,363 133,483 142,602 $133,483 $160,841 NWC 278 Terminal Non-0CF ATSV new m t- NWC = Net Cash Flow $538,113 389,873 $401,21 255,534 $265,695 $538,11 5389,87 576,18 $423,902 5286,01 $1,795,000 30,000$430,50O 5477,075 $494,929 $2,496 200,000 513,675$593,359 511,179 $1,104,538 i = Curmm,ulative CF 1,795,000 $1,405,000 $974,500$497,425 Cost of Capital NPV Analysis Grid: NPV vs Discount Rate & Year 1 Sales Ranges Sales Yr.1 Base 1,000,00O Sales Yr.1Sales Yr.1 Sales Yr.1 Sales Yr.1 PI 1100000 SNPV in Cost of Capita NPV Data Table 5285,914 50 5145,85 5931,569 $1,146,787 5348,327 $550,802 5753,27 5592,13 $85,275 265,635 5446,11 19,37 $783,059 900,065 $716,350 $550,802 30,524
Step by Step Solution
There are 3 Steps involved in it
Step: 1

Get Instant Access to Expert-Tailored Solutions
See step-by-step solutions with expert insights and AI powered tools for academic success
Step: 2

Step: 3
Ace Your Homework with AI
Get the answers you need in no time with our AI-driven, step-by-step assistance
Get Started
Business And The Euro Business Groups And The Politics Of EMU In Britain And Germany And The United Kingdom
Authors: Mark K. Duckenfield
1st Edition
1403998639,0230627242