Answered step by step
Verified Expert Solution
Question
1 Approved Answer
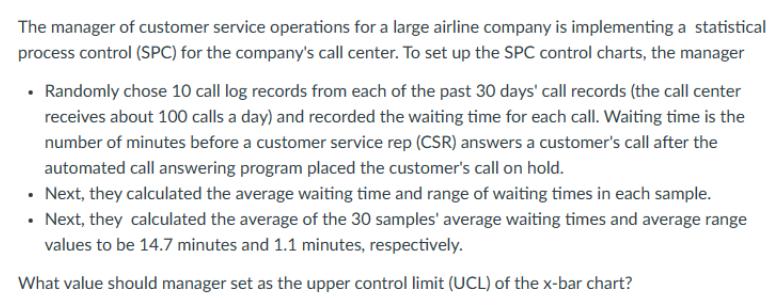
The manager of customer service operations for a large airline company is implementing a statistical process control (SPC) for the company's call center. To


The manager of customer service operations for a large airline company is implementing a statistical process control (SPC) for the company's call center. To set up the SPC control charts, the manager Randomly chose 10 call log records from each of the past 30 days' call records (the call center receives about 100 calls a day) and recorded the waiting time for each call. Waiting time is the number of minutes before a customer service rep (CSR) answers a customer's call after the automated call answering program placed the customer's call on hold. Next, they calculated the average waiting time and range of waiting times in each sample. Next, they calculated the average of the 30 samples' average waiting times and average range values to be 14.7 minutes and 1.1 minutes, respectively. What value should manager set as the upper control limit (UCL) of the x-bar chart? What value should manager set as the lower control limit (LCL) of the R-chart?
Step by Step Solution
There are 3 Steps involved in it
Step: 1
To calculate the upper control limit UCL for the xbar chart in statistical proces...
Get Instant Access to Expert-Tailored Solutions
See step-by-step solutions with expert insights and AI powered tools for academic success
Step: 2

Step: 3

Ace Your Homework with AI
Get the answers you need in no time with our AI-driven, step-by-step assistance
Get Started


