Answered step by step
Verified Expert Solution
Question
1 Approved Answer
Sample number Data 1 74.030 74.002 74.019 73.992 74.008 2 73.995 73.992 74.001 74.011 74.004 3 73.988 74.024 74.021 74.005 74.002 4 74.002 73.996 73.993

| Sample number | Data | ||||
| 1 | 74.030 | 74.002 | 74.019 | 73.992 | 74.008 |
| 2 | 73.995 | 73.992 | 74.001 | 74.011 | 74.004 |
| 3 | 73.988 | 74.024 | 74.021 | 74.005 | 74.002 |
| 4 | 74.002 | 73.996 | 73.993 | 74.015 | 74.009 |
| 5 | 73.992 | 74.007 | 74.015 | 73.989 | 74.014 |
| 6 | 74.009 | 73.994 | 73.997 | 73.985 | 73.993 |
| 7 | 73.995 | 74.006 | 73.994 | 74.000 | 74.005 |
| 8 | 73.985 | 74.003 | 73.993 | 74.015 | 73.988 |
| 9 | 74.008 | 73.995 | 74.009 | 74.005 | 74.004 |
| 10 | 73.998 | 74.000 | 73.990 | 74.007 | 73.995 |
| 11 | 73.994 | 73.998 | 73.994 | 73.995 | 73.990 |
| 12 | 74.004 | 74.000 | 74.007 | 74.000 | 73.996 |
| 13 | 73.983 | 74.002 | 73.998 | 73.997 | 74.012 |
| 14 | 74.006 | 73.967 | 73.994 | 74.000 | 73.984 |
| 15 | 74.012 | 74.014 | 73.998 | 73.999 | 74.007 |
| 16 | 74.000 | 73.984 | 74.005 | 73.998 | 73.996 |
| 17 | 73.994 | 74.012 | 73.986 | 74.005 | 74.007 |
| 18 | 74.006 | 74.010 | 74.018 | 74.003 | 74.000 |
| 19 | 73.984 | 74.002 | 74.003 | 74.005 | 73.997 |
| 20 | 74.000 | 74.010 | 74.013 | 74.020 | 74.003 |
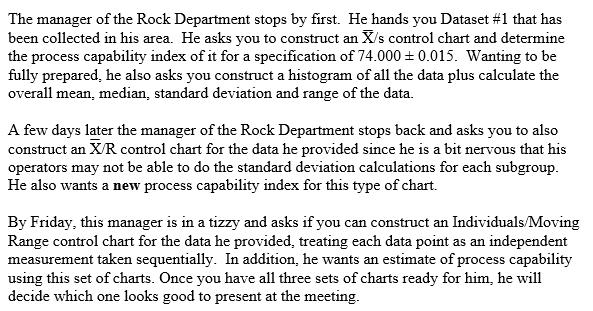
The manager of the Rock Department stops by first. He hands you Dataset #1 that has been collected in his area. He asks you to construct an X/s control chart and determine the process capability index of it for a specification of 74.000 0.015. Wanting to be fully prepared, he also asks you construct a histogram of all the data plus calculate the overall mean, median, standard deviation and range of the data. A few days later the manager of the Rock Department stops back and asks you to also construct an X/R control chart for the data he provided since he is a bit nervous that his operators may not be able to do the standard deviation calculations for each subgroup. He also wants a new process capability index for this type of chart. By Friday, this manager is in a tizzy and asks if you can construct an Individuals/Moving Range control chart for the data he provided, treating each data point as an independent measurement taken sequentially. In addition, he wants an estimate of process capability using this set of charts. Once you have all three sets of charts ready for him, he will decide which one looks good to present at the meeting.
Step by Step Solution
There are 3 Steps involved in it
Step: 1
To tackle the managers requests lets break down the tasks and proceed step by step Step 1 Construct an XS Control Chart The XS control chart is used to monitor the mean and standard deviation of the p...
Get Instant Access to Expert-Tailored Solutions
See step-by-step solutions with expert insights and AI powered tools for academic success
Step: 2

Step: 3

Ace Your Homework with AI
Get the answers you need in no time with our AI-driven, step-by-step assistance
Get Started


