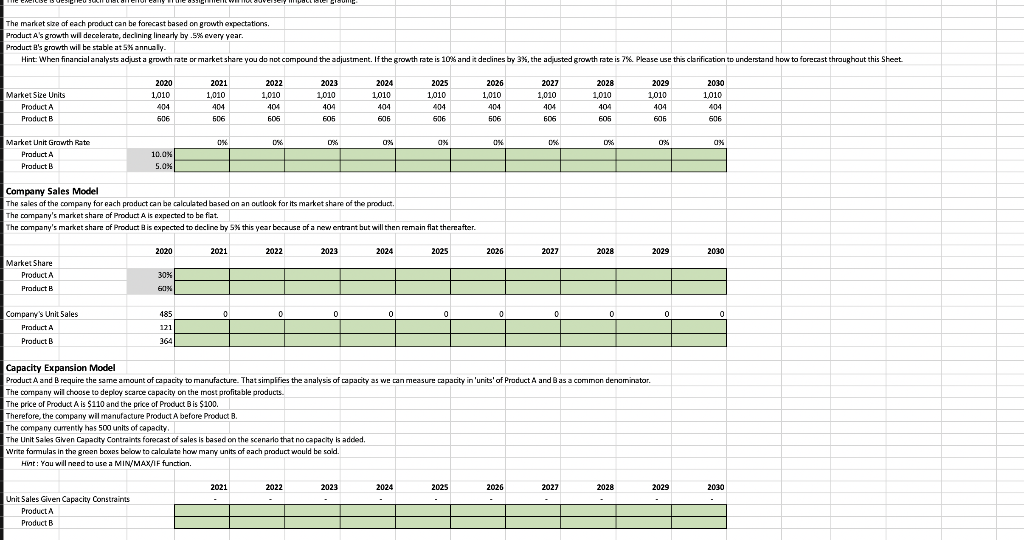
The market size of each product can be forecast based on growth expectations, Product A's growth wildecelerate, decining linearty by .5% every year Producte's growth will be stable at SX annusly. Hint: When financial analysts adjust a growth rate or market share you do not compound the adjustment. If the growth rate is 10% and it dedines by 3%, the adjusted growth rate is 7%. Please use this clarification to understand how to forecast throughout this Sheet Market Size Units Product A Products 2020 1,010 404 506 2030 1,010 2021 1,010 404 606 2022 1,010 404 605 2023 1010 404 2024 1010 404 606 2025 1,010 404 606 2026 1,010 404 506 2027 1,010 404 606 2028 1,010 404 605 2029 1010 404 605 606 606 ON D% 0% 0% ax OK DX 0% OX Market Unit Growth Rate Product A Product B 10.0% 5.0% Company Sales Model The sales of the company for each product can be calculated based on an outlook for its market share of the product The company's market share of Product Als expected to be fat The company's market share of Product is expected to decline by SX this year because of a new entrant but will then remain flat thereafter. 2020 2021 2022 2023 2024 2025 2026 2027 2028 2029 2030 Market Share Product Products 30% 60% 0 0 0 0 0 0 0 0 0 Company's Unit Sales Product A Product B 485 121 364 Capacity Expansion Model Product A and B require the same amount of capacity to manufacture. That simplifies the analysis of capacity as we can measure capacity in 'units' of Product A and B as a common denominator. The company wil choose to deploy scarce capacity on the most profitable products. The price of Product Ais $110 and the price of Product Bis $100. Therefore, the company wil manufacture Product A before Product B. The company currently has 500 units of capacity The Unit Sales Glven Capacity Contraints forecast of sales is based on the scenario that no capacity is added, Write formulas in the green boxes below to calculate how many units of each product would be sold. Hint: You will need to use a MIN/MAX/IF function. 2021 2022 2023 2024 2025 2026 2027 2028 2029 2030 Unit Sales Given Capacity Constraints Product Product The market size of each product can be forecast based on growth expectations, Product A's growth wildecelerate, decining linearty by .5% every year Producte's growth will be stable at SX annusly. Hint: When financial analysts adjust a growth rate or market share you do not compound the adjustment. If the growth rate is 10% and it dedines by 3%, the adjusted growth rate is 7%. Please use this clarification to understand how to forecast throughout this Sheet Market Size Units Product A Products 2020 1,010 404 506 2030 1,010 2021 1,010 404 606 2022 1,010 404 605 2023 1010 404 2024 1010 404 606 2025 1,010 404 606 2026 1,010 404 506 2027 1,010 404 606 2028 1,010 404 605 2029 1010 404 605 606 606 ON D% 0% 0% ax OK DX 0% OX Market Unit Growth Rate Product A Product B 10.0% 5.0% Company Sales Model The sales of the company for each product can be calculated based on an outlook for its market share of the product The company's market share of Product Als expected to be fat The company's market share of Product is expected to decline by SX this year because of a new entrant but will then remain flat thereafter. 2020 2021 2022 2023 2024 2025 2026 2027 2028 2029 2030 Market Share Product Products 30% 60% 0 0 0 0 0 0 0 0 0 Company's Unit Sales Product A Product B 485 121 364 Capacity Expansion Model Product A and B require the same amount of capacity to manufacture. That simplifies the analysis of capacity as we can measure capacity in 'units' of Product A and B as a common denominator. The company wil choose to deploy scarce capacity on the most profitable products. The price of Product Ais $110 and the price of Product Bis $100. Therefore, the company wil manufacture Product A before Product B. The company currently has 500 units of capacity The Unit Sales Glven Capacity Contraints forecast of sales is based on the scenario that no capacity is added, Write formulas in the green boxes below to calculate how many units of each product would be sold. Hint: You will need to use a MIN/MAX/IF function. 2021 2022 2023 2024 2025 2026 2027 2028 2029 2030 Unit Sales Given Capacity Constraints Product Product