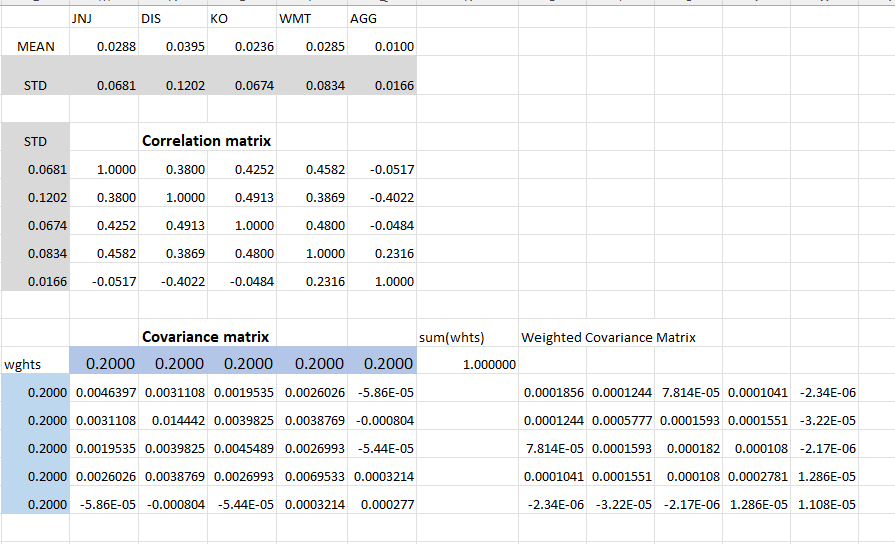
The mean of the least risk portfolio is:
- less than 1%
- less than 2%
- is less than its STD
- is more than its STD
- none of the above
\begin{tabular}{|c|c|c|c|c|c|c|c|c|c|c|c|} \hline & JNJ & DIS & KO & WMT & AGG & & & & & & \\ \hline MEAN & 0.0288 & 0.0395 & 0.0236 & 0.0285 & 0.0100 & & & & & & \\ \hline STD & 0.0681 & 0.1202 & 0.0674 & 0.0834 & 0.0166 & & & & & & \\ \hline STD & & \multicolumn{2}{|c|}{ Correlation matrix } & & & & & & & & \\ \hline 0.0681 & 1.0000 & 0.3800 & 0.4252 & 0.4582 & -0.0517 & & & & & & \\ \hline 0.1202 & 0.3800 & 1.0000 & 0.4913 & 0.3869 & -0.4022 & & & & & & \\ \hline 0.0674 & 0.4252 & 0.4913 & 1.0000 & 0.4800 & -0.0484 & & & & & & \\ \hline 0.0834 & 0.4582 & 0.3869 & 0.4800 & 1.0000 & 0.2316 & & & & & & \\ \hline \multirow[t]{2}{*}{0.0166} & -0.0517 & -0.4022 & -0.0484 & 0.2316 & 1.0000 & & & & & & \\ \hline & & \multicolumn{2}{|c|}{ Covariance matrix } & & & sum(whts) & \multicolumn{3}{|c|}{ Weighted Covariance Matrix } & & \\ \hline wghts & 0.2000 & 0.2000 & 0.2000 & 0.2000 & 0.2000 & 1.000000 & & & & & \\ \hline 0.2000 & 0.0046397 & 0.0031108 & 0.0019535 & 0.0026026 & 55.86E05 & & 0.0001856 & 0.0001244 & 7.814E-05 & 0.0001041 & 2.34E06 \\ \hline 0.2000 & 0.0031108 & 0.014442 & 0.0039825 & 0.0038769 & -0.000804 & & 0.0001244 & 0.0005777 & 0.0001593 & 0.0001551 & 3.22E05 \\ \hline 0.2000 & 0.0019535 & 0.0039825 & 0.0045489 & 0.0026993 & 5.44E05 & & 7.814E05 & 0.0001593 & 0.000182 & 0.000108 & 2.17E06 \\ \hline 0.2000 & 0.0026026 & 0.0038769 & 0.0026993 & 0.0069533 & 0.0003214 & & 0.0001041 & 0.0001551 & 0.000108 & 0.0002781 & 1.286E05 \\ \hline 0.2000 & 5.86E05 & -0.000804 & 5.44E05 & 0.0003214 & 0.000277 & & 2.34E06 & 3.22E05 & 2.17E06 & 1.286E05 & 1.108E05 \\ \hline \end{tabular} 13 provide the optimal allocation of the least risk portfolio in the highlighted cells under their ticker names, its mean and its std under their respective headings. Answer thequestion below the highlighted cells