Answered step by step
Verified Expert Solution
Question
1 Approved Answer
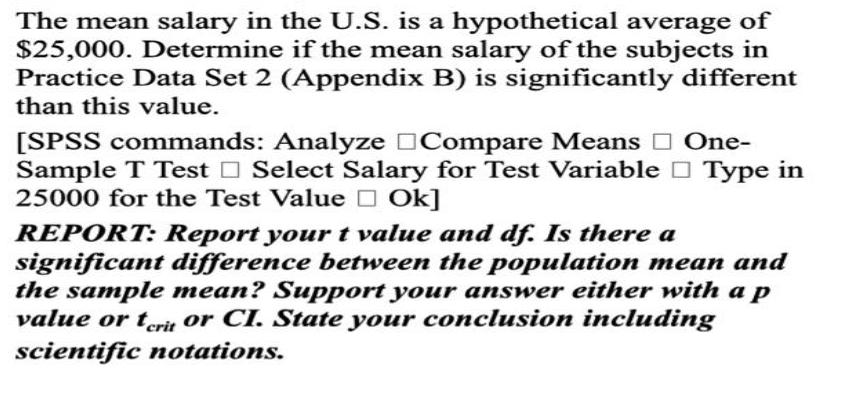
The mean salary in the U.S. is a hypothetical average of $25,000. Determine if the mean salary of the subjects in Practice Data Set


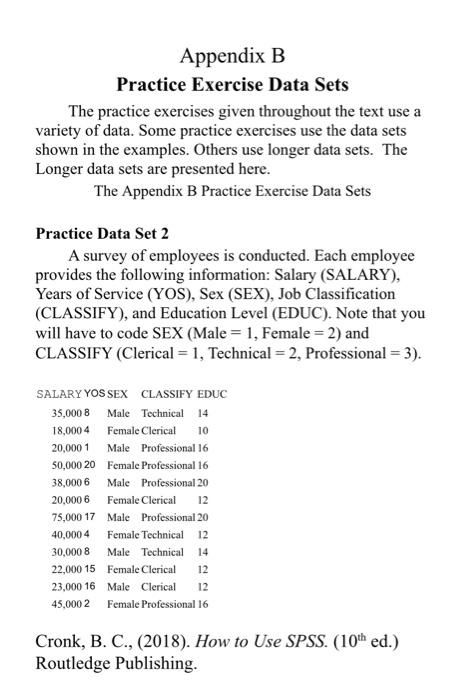
The mean salary in the U.S. is a hypothetical average of $25,000. Determine if the mean salary of the subjects in Practice Data Set 2 (Appendix B) is significantly different than this value. [SPSS commands: Analyze OCompare Means O One- Sample T Test O Select Salary for Test Variable O Type in 25000 for the Test Value D Ok] REPORT: Report your t value and df. Is there a significant difference between the population mean and the sample mean? Support your answer either with a p value or teri or CI. State your conclusion including scientific notations. Appendix B Practice Exercise Data Sets The practice exercises given throughout the text use a variety of data. Some practice exercises use the data sets shown in the examples. Others use longer data sets. The Longer data sets are presented here. The Appendix B Practice Exercise Data Sets Practice Data Set 2 A survey of employees is conducted. Each employee provides the following information: Salary (SALARY), Years of Service (YOS), Sex (SEX), Job Classification (CLASSIFY), and Education Level (EDUC). Note that you will have to code SEX (Male = 1, Female = 2) and CLASSIFY (Clerical = 1, Technical = 2, Professional = 3). SALARY YOS SEX CLASSIFY EDUC 35,000 8 Male Technical 14 18,000 4 Female Clerical 10 20,000 1 Male Professional 16 50,000 20 Female Professional 16 38,000 6 Male Professional 20 20,000 6 Female Clerical 12 75,000 17 Male Professional 20 40,000 4 Female Technical 12 30,000 8 Male Technical 14 22,000 15 Female Clerical 12 23,000 16 Male Clerical 12 45,000 2 Female Professional 16 Cronk, B. C., (2018). How to Use SPSS. (10th ed.) Routledge Publishing.
Step by Step Solution
★★★★★
3.38 Rating (164 Votes )
There are 3 Steps involved in it
Step: 1
Result Since the pvalue is greater t...
Get Instant Access to Expert-Tailored Solutions
See step-by-step solutions with expert insights and AI powered tools for academic success
Step: 2

Step: 3

Document Format ( 2 attachments)
635d5f7871ba1_174992.pdf
180 KBs PDF File
635d5f7871ba1_174992.docx
120 KBs Word File
Ace Your Homework with AI
Get the answers you need in no time with our AI-driven, step-by-step assistance
Get Started


