Question
The mean waiting time at the drive-through of a fast-food restaurant from the time an order is placed to the time the order is received
The mean waiting time at the drive-through of a fast-food restaurant from the time an order is placed to the time the order is received is
85.185.1
seconds. A manager devises a new drive-through system that
hehe
believes will decrease wait time. As a test,
hehe
initiates the new system at
hishis
restaurant and measures the wait time for
1010
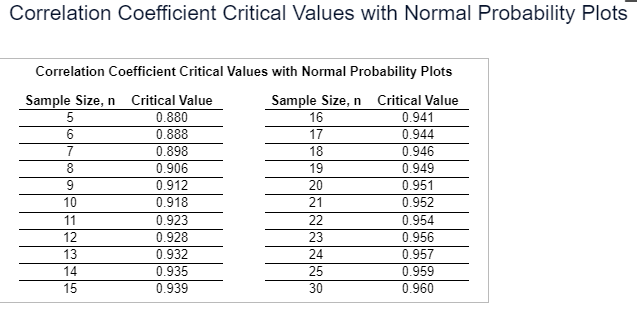
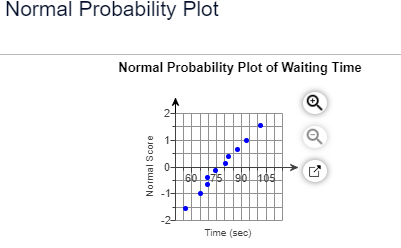
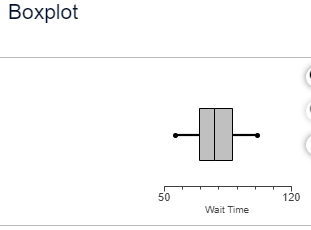
randomly selected orders. The wait times are provided in the accompanying table. The normal probability plot and boxplot for the sample are provided. Complete parts (a) and (b). 101.4 69.5 56.2 74.6 65.3 80.6 93.2 87.6 69.3 82.3


Step by Step Solution
There are 3 Steps involved in it
Step: 1

Get Instant Access to Expert-Tailored Solutions
See step-by-step solutions with expert insights and AI powered tools for academic success
Step: 2

Step: 3

Ace Your Homework with AI
Get the answers you need in no time with our AI-driven, step-by-step assistance
Get Started


