

Answered step by step
Verified Expert Solution
Question
1 Approved Answer
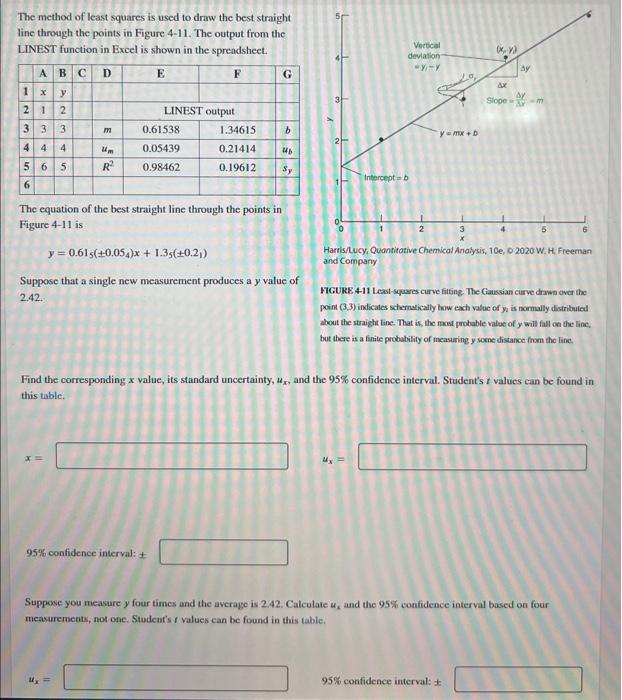
The method of least squares is used to draw the best straight line through the points in Fugure 4-11. The output from the LINEST function
Step by Step Solution
There are 3 Steps involved in it
Step: 1

Get Instant Access to Expert-Tailored Solutions
See step-by-step solutions with expert insights and AI powered tools for academic success
Step: 2

Step: 3
Ace Your Homework with AI
Get the answers you need in no time with our AI-driven, step-by-step assistance
Get Started
Pro Oracle Fusion Applications Installation And Administration
Authors: Tushar Thakker
1st Edition
1484209834, 9781484209837