Answered step by step
Verified Expert Solution
Question
1 Approved Answer
The MFI Asmitha wants to estimate the annual percentage rate (APR) that should be charged in 2019 in order to be sustainable and independent from
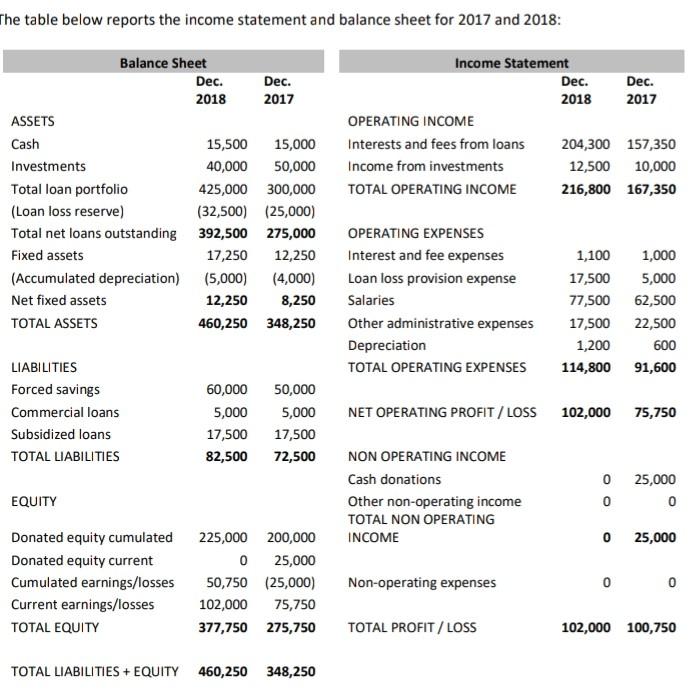
The MFI Asmitha wants to estimate the annual percentage rate (APR) that should be charged in 2019 in order to be sustainable and independent from donor support. You are the financial analyst of the MFI, and were asked to estimate the APR, given the following information: Projected market rate for saving deposits of 8%, 18% on commercial loans and 7% as inflation rate are forecasted for 2016. The target capitalization rate is 15%

The table below reports the income statement and balance sheet for 2017 and 2018: Income Statement Dec. Dec. 2017 2018 Balance Sheet Dec. Dec. 2018 2017 ASSETS Cash 15,500 15,000 Investments 40,000 50,000 Total loan portfolio 425,000 300,000 (Loan loss reserve) (32,500) (25,000) Total net loans outstanding 392,500 275,000 Fixed assets 17,250 12,250 (Accumulated depreciation) (5,000) (4,000) Net fixed assets 12,250 8,250 TOTAL ASSETS 460,250 348,250 OPERATING INCOME Interests and fees from loans Income from investments TOTAL OPERATING INCOME 204,300 157,350 12,500 10,000 216,800 167,350 OPERATING EXPENSES Interest and fee expenses Loan loss provision expense Salaries Other administrative expenses Depreciation TOTAL OPERATING EXPENSES 1,100 1,000 17,500 5,000 77,500 62,500 17,500 22,500 1,200 600 114,800 91,600 LIABILITIES Forced savings Commercial loans Subsidized loans TOTAL LIABILITIES NET OPERATING PROFIT / LOSS 102,000 75,750 60,000 5,000 17,500 82,500 50,000 5,000 17,500 72,500 NON OPERATING INCOME Cash donations Other non-operating income TOTAL NON OPERATING INCOME 0 25,000 0 0 EQUITY 0 25,000 Donated equity cumulated 225,000 200,000 Donated equity current 0 25,000 Cumulated earnings/losses 50,750 (25,000) Current earnings/losses 102,000 75,750 TOTAL EQUITY 377,750 275,750 Non-operating expenses 0 TOTAL PROFIT / LOSS 102,000 100,750 TOTAL LIABILITIES + EQUITY 460,250 348,250 The table below reports the income statement and balance sheet for 2017 and 2018: Income Statement Dec. Dec. 2017 2018 Balance Sheet Dec. Dec. 2018 2017 ASSETS Cash 15,500 15,000 Investments 40,000 50,000 Total loan portfolio 425,000 300,000 (Loan loss reserve) (32,500) (25,000) Total net loans outstanding 392,500 275,000 Fixed assets 17,250 12,250 (Accumulated depreciation) (5,000) (4,000) Net fixed assets 12,250 8,250 TOTAL ASSETS 460,250 348,250 OPERATING INCOME Interests and fees from loans Income from investments TOTAL OPERATING INCOME 204,300 157,350 12,500 10,000 216,800 167,350 OPERATING EXPENSES Interest and fee expenses Loan loss provision expense Salaries Other administrative expenses Depreciation TOTAL OPERATING EXPENSES 1,100 1,000 17,500 5,000 77,500 62,500 17,500 22,500 1,200 600 114,800 91,600 LIABILITIES Forced savings Commercial loans Subsidized loans TOTAL LIABILITIES NET OPERATING PROFIT / LOSS 102,000 75,750 60,000 5,000 17,500 82,500 50,000 5,000 17,500 72,500 NON OPERATING INCOME Cash donations Other non-operating income TOTAL NON OPERATING INCOME 0 25,000 0 0 EQUITY 0 25,000 Donated equity cumulated 225,000 200,000 Donated equity current 0 25,000 Cumulated earnings/losses 50,750 (25,000) Current earnings/losses 102,000 75,750 TOTAL EQUITY 377,750 275,750 Non-operating expenses 0 TOTAL PROFIT / LOSS 102,000 100,750 TOTAL LIABILITIES + EQUITY 460,250 348,250
Step by Step Solution
There are 3 Steps involved in it
Step: 1

Get Instant Access to Expert-Tailored Solutions
See step-by-step solutions with expert insights and AI powered tools for academic success
Step: 2

Step: 3

Ace Your Homework with AI
Get the answers you need in no time with our AI-driven, step-by-step assistance
Get Started


