Question
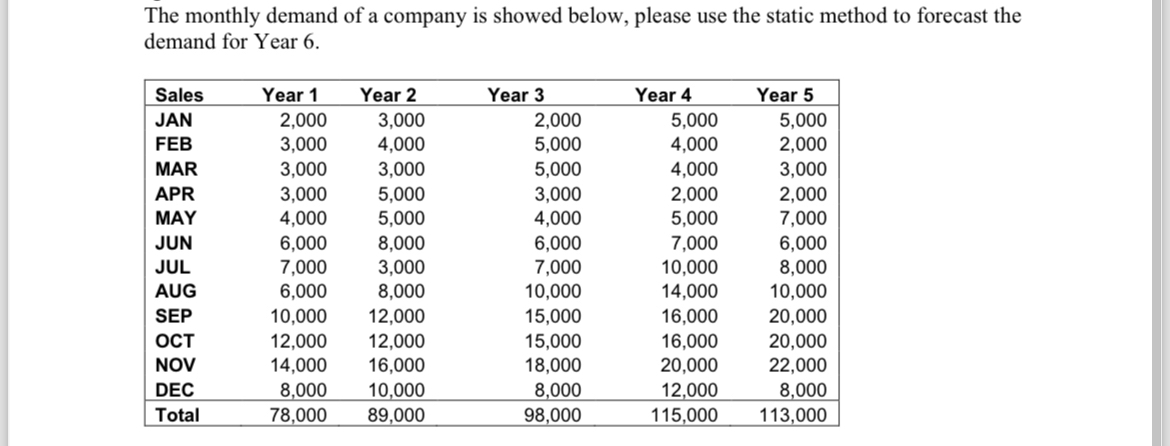
The monthly demand of a company is showed below, please use the static method to forecast the demand for Year 6. Sales Year 1

The monthly demand of a company is showed below, please use the static method to forecast the demand for Year 6. Sales Year 1 Year 2 Year 3 Year 4 Year 5 JAN 2,000 3,000 2,000 5,000 5,000 FEB 3,000 4,000 5,000 4,000 2,000 MAR 3,000 3,000 5,000 4,000 3,000 APR 3,000 5,000 3,000 2,000 2,000 MAY 4,000 5,000 4,000 5,000 7,000 JUN 6,000 8,000 6,000 7,000 6,000 JUL 7,000 3,000 7,000 10,000 8,000 AUG 6,000 8,000 10,000 14,000 10,000 SEP 10,000 12,000 15,000 16,000 20,000 12,000 12,000 15,000 16,000 20,000 NOV 14,000 16,000 18,000 20,000 22,000 DEC 8,000 10,000 8,000 12,000 8,000 Total 78,000 89,000 98,000 115,000 113,000
Step by Step Solution
There are 3 Steps involved in it
Step: 1

Get Instant Access to Expert-Tailored Solutions
See step-by-step solutions with expert insights and AI powered tools for academic success
Step: 2

Step: 3

Ace Your Homework with AI
Get the answers you need in no time with our AI-driven, step-by-step assistance
Get StartedRecommended Textbook for
Introduction to Operations Research
Authors: Frederick S. Hillier, Gerald J. Lieberman
10th edition
978-0072535105, 72535105, 978-1259162985
Students also viewed these Accounting questions
Question
Answered: 1 week ago
Question
Answered: 1 week ago
Question
Answered: 1 week ago
Question
Answered: 1 week ago
Question
Answered: 1 week ago
Question
Answered: 1 week ago
Question
Answered: 1 week ago
Question
Answered: 1 week ago
Question
Answered: 1 week ago
Question
Answered: 1 week ago
Question
Answered: 1 week ago
Question
Answered: 1 week ago
Question
Answered: 1 week ago
Question
Answered: 1 week ago
Question
Answered: 1 week ago
Question
Answered: 1 week ago
Question
Answered: 1 week ago
Question
Answered: 1 week ago
Question
Answered: 1 week ago
Question
Answered: 1 week ago
View Answer in SolutionInn App


