Question
The monthly sales data of Murphy Brothers Furniture from Year 2009 to Year 2014 are provided in the file Assignment 2 Template.xlsx. Using the sales
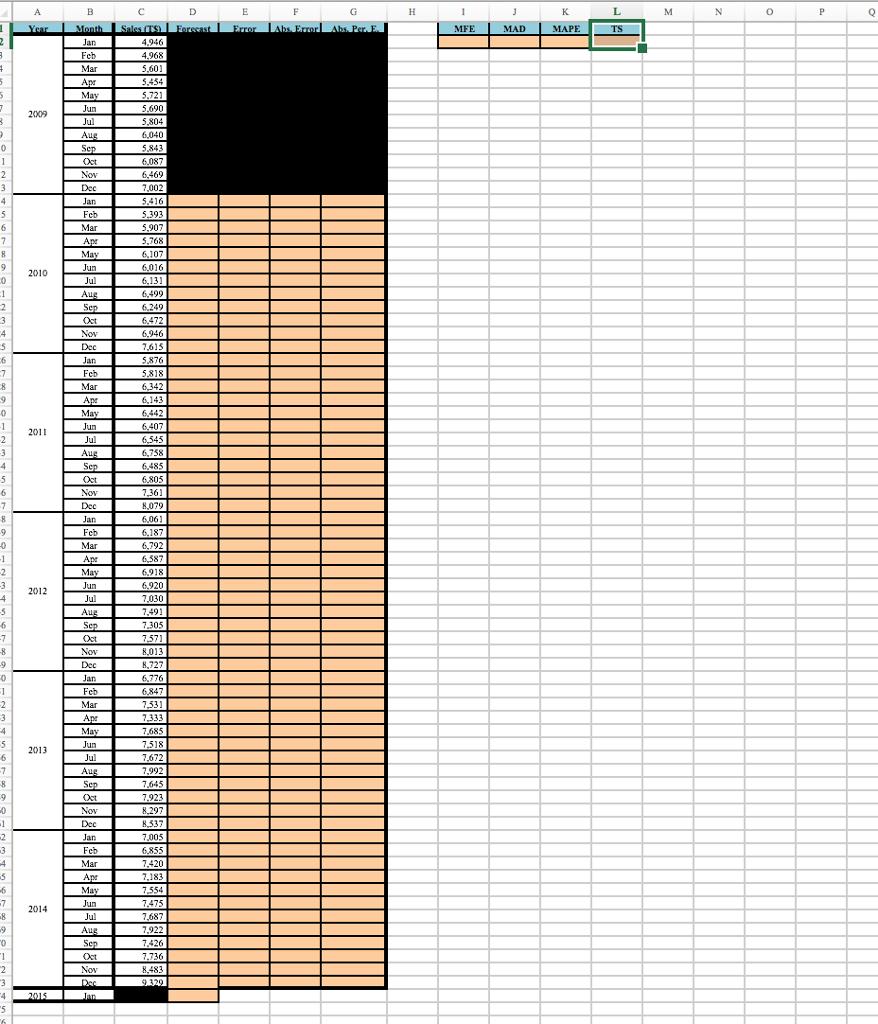
The monthly sales data of Murphy Brothers Furniture from Year 2009 to Year 2014 are provided in the file “Assignment 2 Template.xlsx”. Using the sales data, develop forecasting models for the period from Jan 2010 to Jan 2015, based on the following sub-questions. For questions from (2) to (6), show the accuracy measures: Mean Forecast Error (MFE), Mean Absolute Deviation (MAD), Mean Absolute Percentage Error (MAPE), and Tracking Signal (TS).
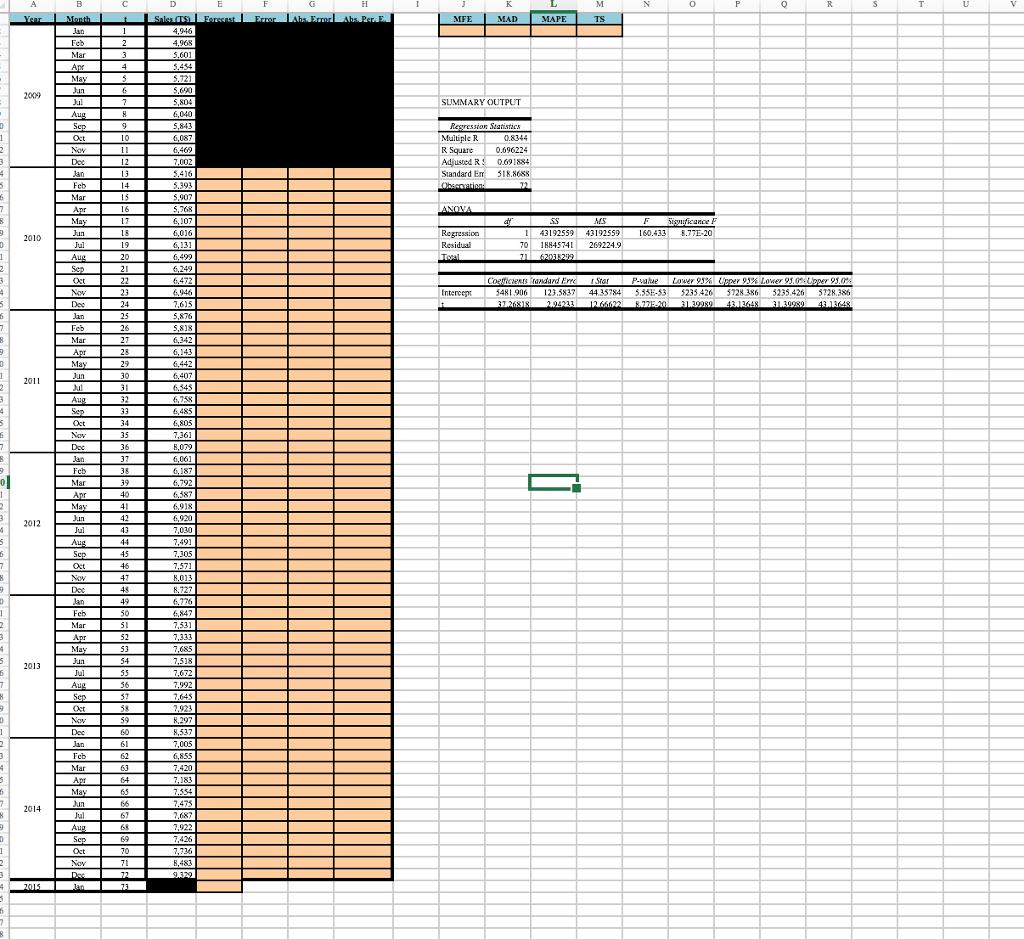
(1) Draw a chart and show the linear trend and its equation.
(2) Develop the naïve forecast model (last period) using the single previous sales amount.
(3) Perform the 3-month simple moving average.
(4) Perform the 3-month weighted moving average using the weights 0.5, 0.3, and 0.2 respectively in more recent order.
(5) Perform the exponential smoothing using alpha value 0.3. (Set the forecast sales for Jan 2010 as the sales amount of the previous month (Dec 2009)).
(6) Show forecast values for each month using the linear trend (regression): Use the given table for the forecast.
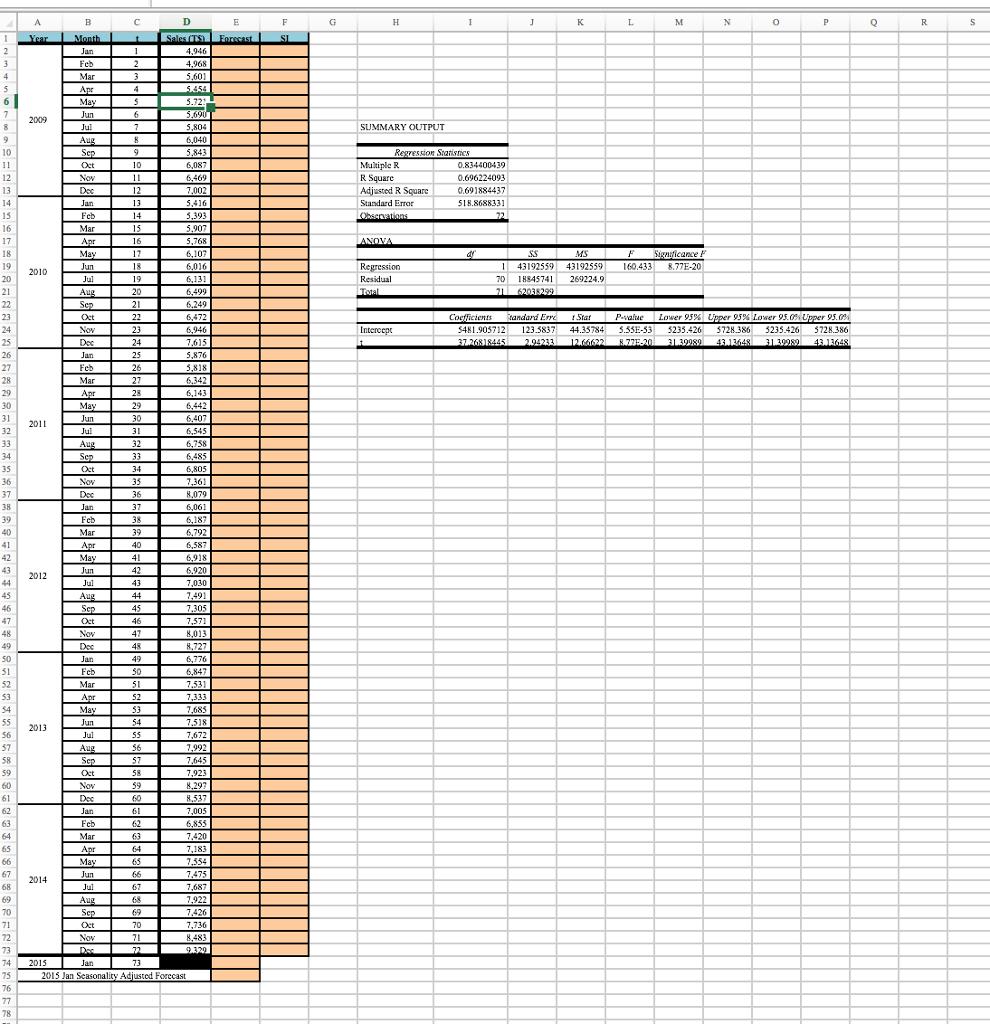
(7) After showing forecast value for each month using the linear trend model, calculate the seasonal index for Jan, and generate the new forecast value for Jan 2015. (Create the trendline forecast from Jan 2009 to Dec 2014 to calculate the seasonal index for January.)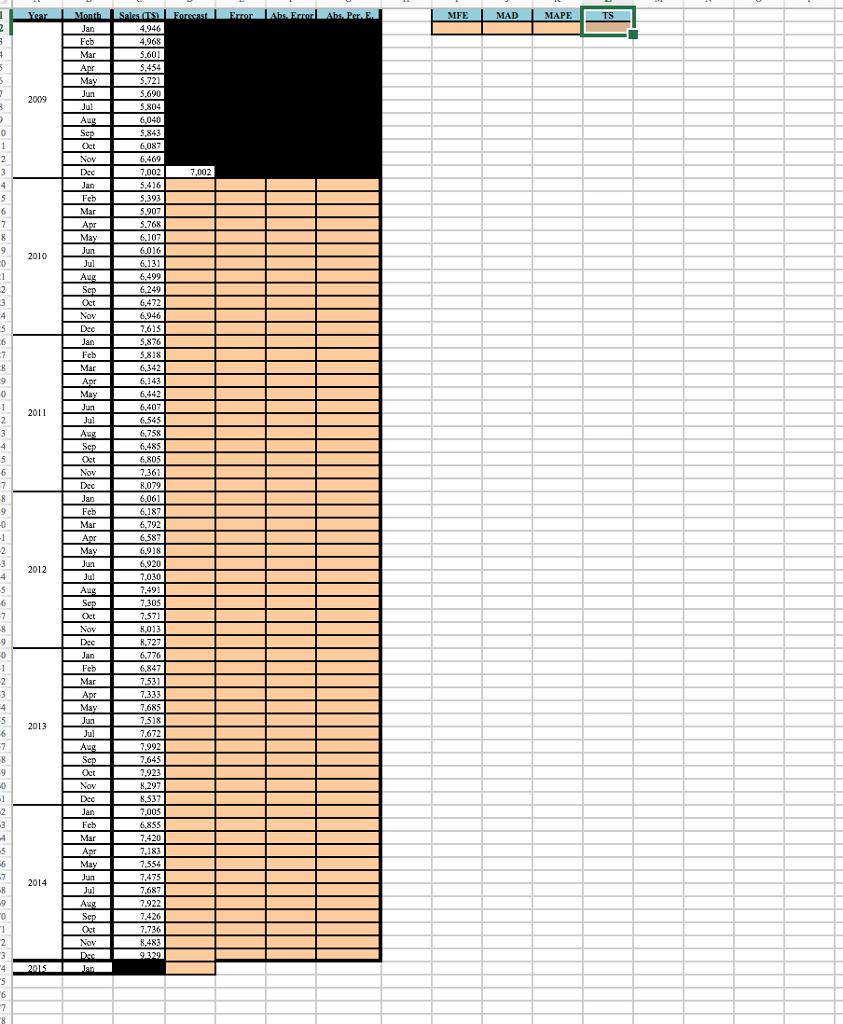
Year Month Sales TS Forecast Jan Error LAbs. ErrorAhs. Per. E. MFE MAD MAPE TS 4,946 Feb 4,968 Mar 5,601 Apr May 5,454 5,721 Jun 5,690 2009 Jul 5,804 Aug 6,040 5,843 Sep Oct 1 6,087 2 Nov 6,469 3 Dec 7,002 7,002 4 Jan 5.416 Feb 5.393 5.907 5.768 Mar 7. Apr May 6,107 Jun 6.016 2010 Jul 6.131 Aug 6,499 Sep 6,249 Oct 6,472 Nov 6.946 7,615 5,876 5818 Dec Jan Feb Mar 6.342 6,143 Apr May Jun Jul 6,442 6,407 2011 2 6,545 Aug Sep 6,758 4 6.485 -5 Oct 6,805 Nov 7,361 8,079 Dec Jan 6,061 6.187 Feb Mar Apr 6,792 6,587 -1 -2 -3 4 May 6,918 Jun 6,920 2012 Jul 7,030 Aug 7.491 7,305 7,571 8,013 R,727 6,776 Sep -7 Oct Nov Dec Jan Feb Mar 6,847 2 7.531 7,333 Apr May 7.685 7.518 7.672 Jun 2013 Jul Aug Sep Oct 7.992 7,645 Oct 7,923 8,297 8,537 Nov Dec 2 3 Jan 7,005 6,855 Feb Mar 7,420 7,183 7.554 7.475 7,687 Apr May Jun 2014 Jul Ang Sep Oct 7.922 7.426 7,736 2 Nov 8,483 9.329 "4 2015 Jan Jan "8
Step by Step Solution
3.39 Rating (165 Votes )
There are 3 Steps involved in it
Step: 1
1 Draw a chart and show the linear trend and its equation As shown in the following image also the l...
Get Instant Access to Expert-Tailored Solutions
See step-by-step solutions with expert insights and AI powered tools for academic success
Step: 2

Step: 3

Ace Your Homework with AI
Get the answers you need in no time with our AI-driven, step-by-step assistance
Get Started


