The Nike's Statements of Cash Flows and balance sheet for years 2013, 2014, and 2015 are provided.
In addition, you are provided the following information and assumptions:
- Nikes applicable tax rate is 35%.
- Nikes interest receipts for fiscal years 2013, 2014 & 2015 are $6, $8 and $12 million, respectively.
- Nikes cost of capital is 7.5%.
- Nikes free cash flow is expected to grow at 4% per annum for from 2015 to 2016 and continue to grow at that rate up to 2020.
- Nikes free cash flow will grow at 2% on average per annum from 2020 to 2021 onwards.
- The total value of liabilities can be obtained from the balance sheet.
- At year-end 2015, Nike had 855,351,589 common shares outstanding.
Required:
You are required to prepare an Excel spreadsheet to perform the following tasks:
1. Calculate the free cash flows for fiscal years 2013, 2014 and 2015.
2. Then, calculate the intrinsic equity value per share of Nike Inc. as of May. 31, 2015 using the discounted cash flow valuation method.
3. Explain the limitations of applying the cash flow valuation model specifically within the context of Nike Inc.
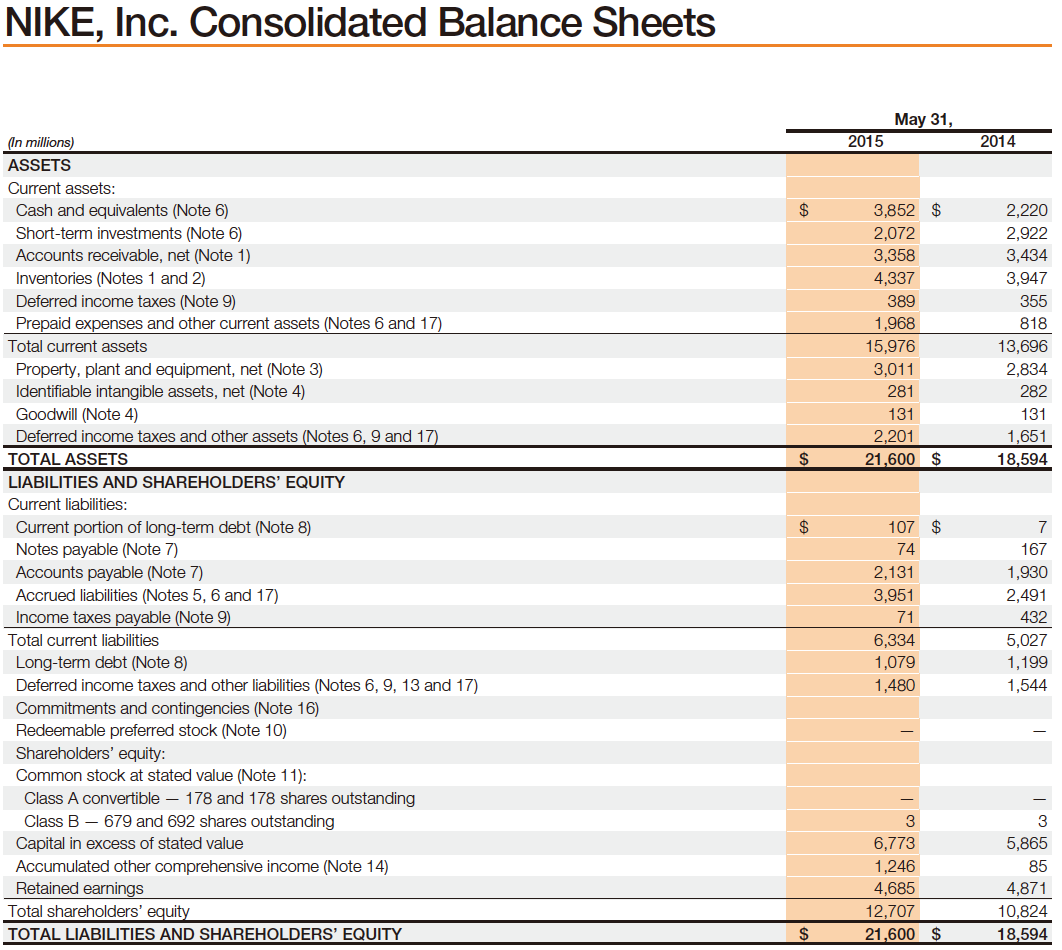
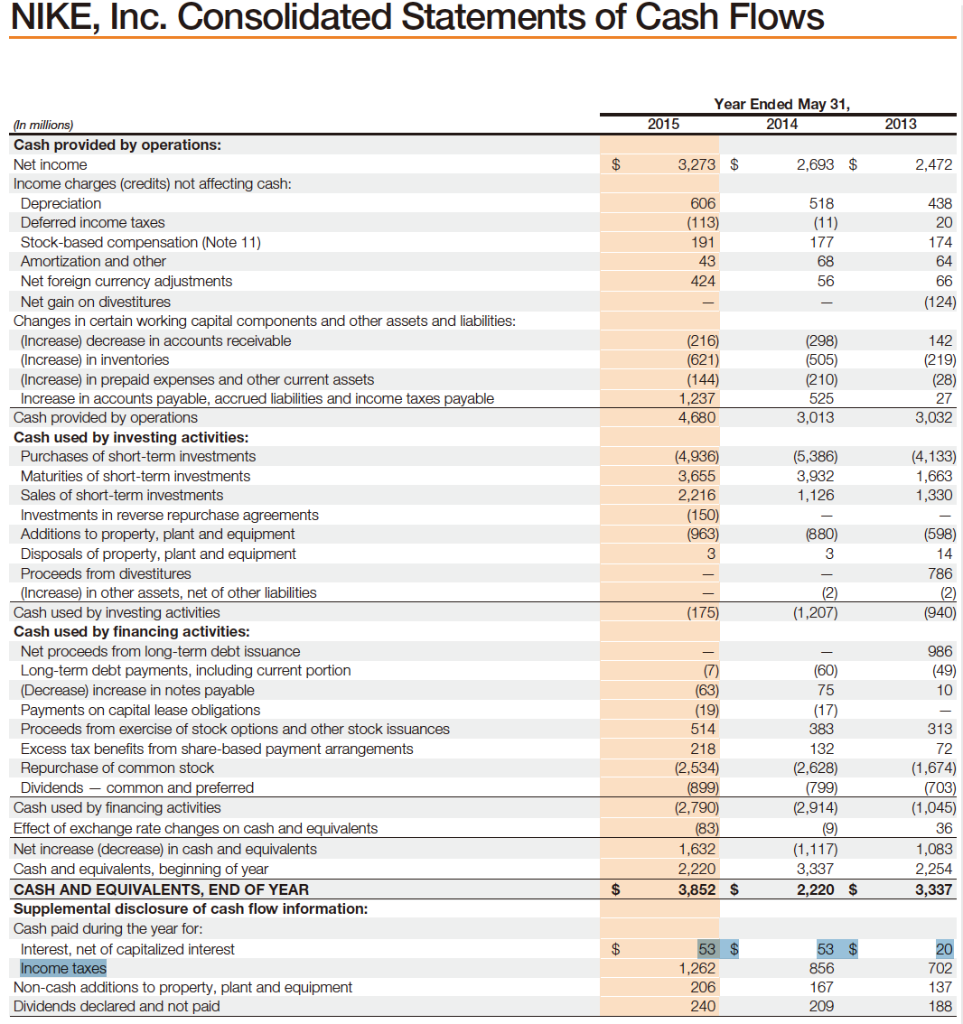
NIKE, Inc. Consolidated Balance Sheets May 31, 2015 2014 3,852 $ 2,072 3,358 4,337 389 1,968 15,976 3,011 281 131 2,201 21,600 $ 2,220 2,922 3,434 3,947 355 818 13,696 2,834 282 131 1,651 18,594 $ (In millions) ASSETS Current assets: Cash and equivalents (Note 6) Short-term investments (Note 6) Accounts receivable, net (Note 1) Inventories (Notes 1 and 2) Deferred income taxes (Note 9) Prepaid expenses and other current assets (Notes 6 and 17) Total current assets Property, plant and equipment, net (Note 3) Identifiable intangible assets, net (Note 4) Goodwill (Note 4) Deferred income taxes and other assets (Notes 6, 9 and 17) TOTAL ASSETS LIABILITIES AND SHAREHOLDERS' EQUITY Current liabilities: Current portion of long-term debt (Note 8) Notes payable (Note 7) Accounts payable (Note 7) Accrued liabilities (Notes 5, 6 and 17) Income taxes payable (Note 9) Total current liabilities Long-term debt (Note 8) Deferred income taxes and other liabilities (Notes 6, 9, 13 and 17) Commitments and contingencies (Note 16) Redeemable preferred stock (Note 10) Shareholders' equity: Common stock at stated value (Note 11): Class A convertible 178 and 178 shares outstanding Class B - 679 and 692 shares outstanding Capital in excess of stated value Accumulated other comprehensive income (Note 14) Retained earnings Total shareholders' equity TOTAL LIABILITIES AND SHAREHOLDERS' EQUITY 107 $ 74 2,131 3,951 71 6,334 1,079 1,480 7 167 1,930 2,491 432 5,027 1,199 1,544 3 6,773 1,246 4,685 12,707 21,600 $ 3 5,865 85 4,871 10,824 18,594 $ NIKE, Inc. Consolidated Statements of Cash Flows Year Ended May 31, 2014 2015 2013 $ 3,273 $ 2,693 $ 2,472 606 (113) 191 43 518 (11) 177 68 56 438 20 174 64 66 (124) 424 (216) (621) (144) 1,237 4,680 (298) (505) (210) 525 3,013 142 (219) (28) 27 3,032 (5,386) 3,932 1,126 (4,133) 1,663 1,330 (4,936) 3,655 2,216 (150) (963) 3 (880) 3 (598) 14 (In millions) Cash provided by operations: Net income Income charges (credits) not affecting cash: Depreciation Deferred income taxes Stock-based compensation (Note 11) Amortization and other Net foreign currency adjustments Net gain on divestitures Changes in certain working capital components and other assets and liabilities: (Increase) decrease in accounts receivable (Increase) in inventories (Increase) in prepaid expenses and other current assets Increase in accounts payable, accrued liabilities and income taxes payable Cash provided by operations Cash used by investing activities: Purchases of short-term investments Maturities of short-term investments Sales of short-term investments Investments in reverse repurchase agreements Additions to property, plant and equipment Disposals of property, plant and equipment Proceeds from divestitures (Increase) in other assets, net of other liabilities Cash used by investing activities Cash used by financing activities: Net proceeds from long-term debt issuance Long-term debt payments, including current portion (Decrease) increase in notes payable Payments on capital lease obligations Proceeds from exercise of stock options and other stock issuances Excess tax benefits from share-based payment arrangements Repurchase of common stock Dividends - common and preferred Cash used by financing activities Effect of exchange rate changes on cash and equivalents Net increase (decrease) in cash and equivalents Cash and equivalents, beginning of year CASH AND EQUIVALENTS, END OF YEAR Supplemental disclosure of cash flow information: Cash paid during the year for: Interest, net of capitalized interest Income taxes Non-cash additions to property, plant and equipment Dividends declared and not paid 786 (2) (1,207) (2) (940) (175) 986 (49) 10 (7) (63) (19) 514 218 (2,534) (899) (2,790) (83) 1,632 2,220 3,852 $ (60) 75 (17) 383 132 (2,628) (799) (2,914) (9) (1,117) 3,337 2.220 $ 313 72 (1,674) (703) (1,045) 36 1,083 2,254 3,337 $ $ 53 1,262 206 240 53 $ 856 167 209 20 702 137 188 NIKE, Inc. Consolidated Balance Sheets May 31, 2015 2014 3,852 $ 2,072 3,358 4,337 389 1,968 15,976 3,011 281 131 2,201 21,600 $ 2,220 2,922 3,434 3,947 355 818 13,696 2,834 282 131 1,651 18,594 $ (In millions) ASSETS Current assets: Cash and equivalents (Note 6) Short-term investments (Note 6) Accounts receivable, net (Note 1) Inventories (Notes 1 and 2) Deferred income taxes (Note 9) Prepaid expenses and other current assets (Notes 6 and 17) Total current assets Property, plant and equipment, net (Note 3) Identifiable intangible assets, net (Note 4) Goodwill (Note 4) Deferred income taxes and other assets (Notes 6, 9 and 17) TOTAL ASSETS LIABILITIES AND SHAREHOLDERS' EQUITY Current liabilities: Current portion of long-term debt (Note 8) Notes payable (Note 7) Accounts payable (Note 7) Accrued liabilities (Notes 5, 6 and 17) Income taxes payable (Note 9) Total current liabilities Long-term debt (Note 8) Deferred income taxes and other liabilities (Notes 6, 9, 13 and 17) Commitments and contingencies (Note 16) Redeemable preferred stock (Note 10) Shareholders' equity: Common stock at stated value (Note 11): Class A convertible 178 and 178 shares outstanding Class B - 679 and 692 shares outstanding Capital in excess of stated value Accumulated other comprehensive income (Note 14) Retained earnings Total shareholders' equity TOTAL LIABILITIES AND SHAREHOLDERS' EQUITY 107 $ 74 2,131 3,951 71 6,334 1,079 1,480 7 167 1,930 2,491 432 5,027 1,199 1,544 3 6,773 1,246 4,685 12,707 21,600 $ 3 5,865 85 4,871 10,824 18,594 $ NIKE, Inc. Consolidated Statements of Cash Flows Year Ended May 31, 2014 2015 2013 $ 3,273 $ 2,693 $ 2,472 606 (113) 191 43 518 (11) 177 68 56 438 20 174 64 66 (124) 424 (216) (621) (144) 1,237 4,680 (298) (505) (210) 525 3,013 142 (219) (28) 27 3,032 (5,386) 3,932 1,126 (4,133) 1,663 1,330 (4,936) 3,655 2,216 (150) (963) 3 (880) 3 (598) 14 (In millions) Cash provided by operations: Net income Income charges (credits) not affecting cash: Depreciation Deferred income taxes Stock-based compensation (Note 11) Amortization and other Net foreign currency adjustments Net gain on divestitures Changes in certain working capital components and other assets and liabilities: (Increase) decrease in accounts receivable (Increase) in inventories (Increase) in prepaid expenses and other current assets Increase in accounts payable, accrued liabilities and income taxes payable Cash provided by operations Cash used by investing activities: Purchases of short-term investments Maturities of short-term investments Sales of short-term investments Investments in reverse repurchase agreements Additions to property, plant and equipment Disposals of property, plant and equipment Proceeds from divestitures (Increase) in other assets, net of other liabilities Cash used by investing activities Cash used by financing activities: Net proceeds from long-term debt issuance Long-term debt payments, including current portion (Decrease) increase in notes payable Payments on capital lease obligations Proceeds from exercise of stock options and other stock issuances Excess tax benefits from share-based payment arrangements Repurchase of common stock Dividends - common and preferred Cash used by financing activities Effect of exchange rate changes on cash and equivalents Net increase (decrease) in cash and equivalents Cash and equivalents, beginning of year CASH AND EQUIVALENTS, END OF YEAR Supplemental disclosure of cash flow information: Cash paid during the year for: Interest, net of capitalized interest Income taxes Non-cash additions to property, plant and equipment Dividends declared and not paid 786 (2) (1,207) (2) (940) (175) 986 (49) 10 (7) (63) (19) 514 218 (2,534) (899) (2,790) (83) 1,632 2,220 3,852 $ (60) 75 (17) 383 132 (2,628) (799) (2,914) (9) (1,117) 3,337 2.220 $ 313 72 (1,674) (703) (1,045) 36 1,083 2,254 3,337 $ $ 53 1,262 206 240 53 $ 856 167 209 20 702 137 188