The null hypothesis of independence oi the two classications Aand B as shown on the 3x 3 contingency table was relected at the a =
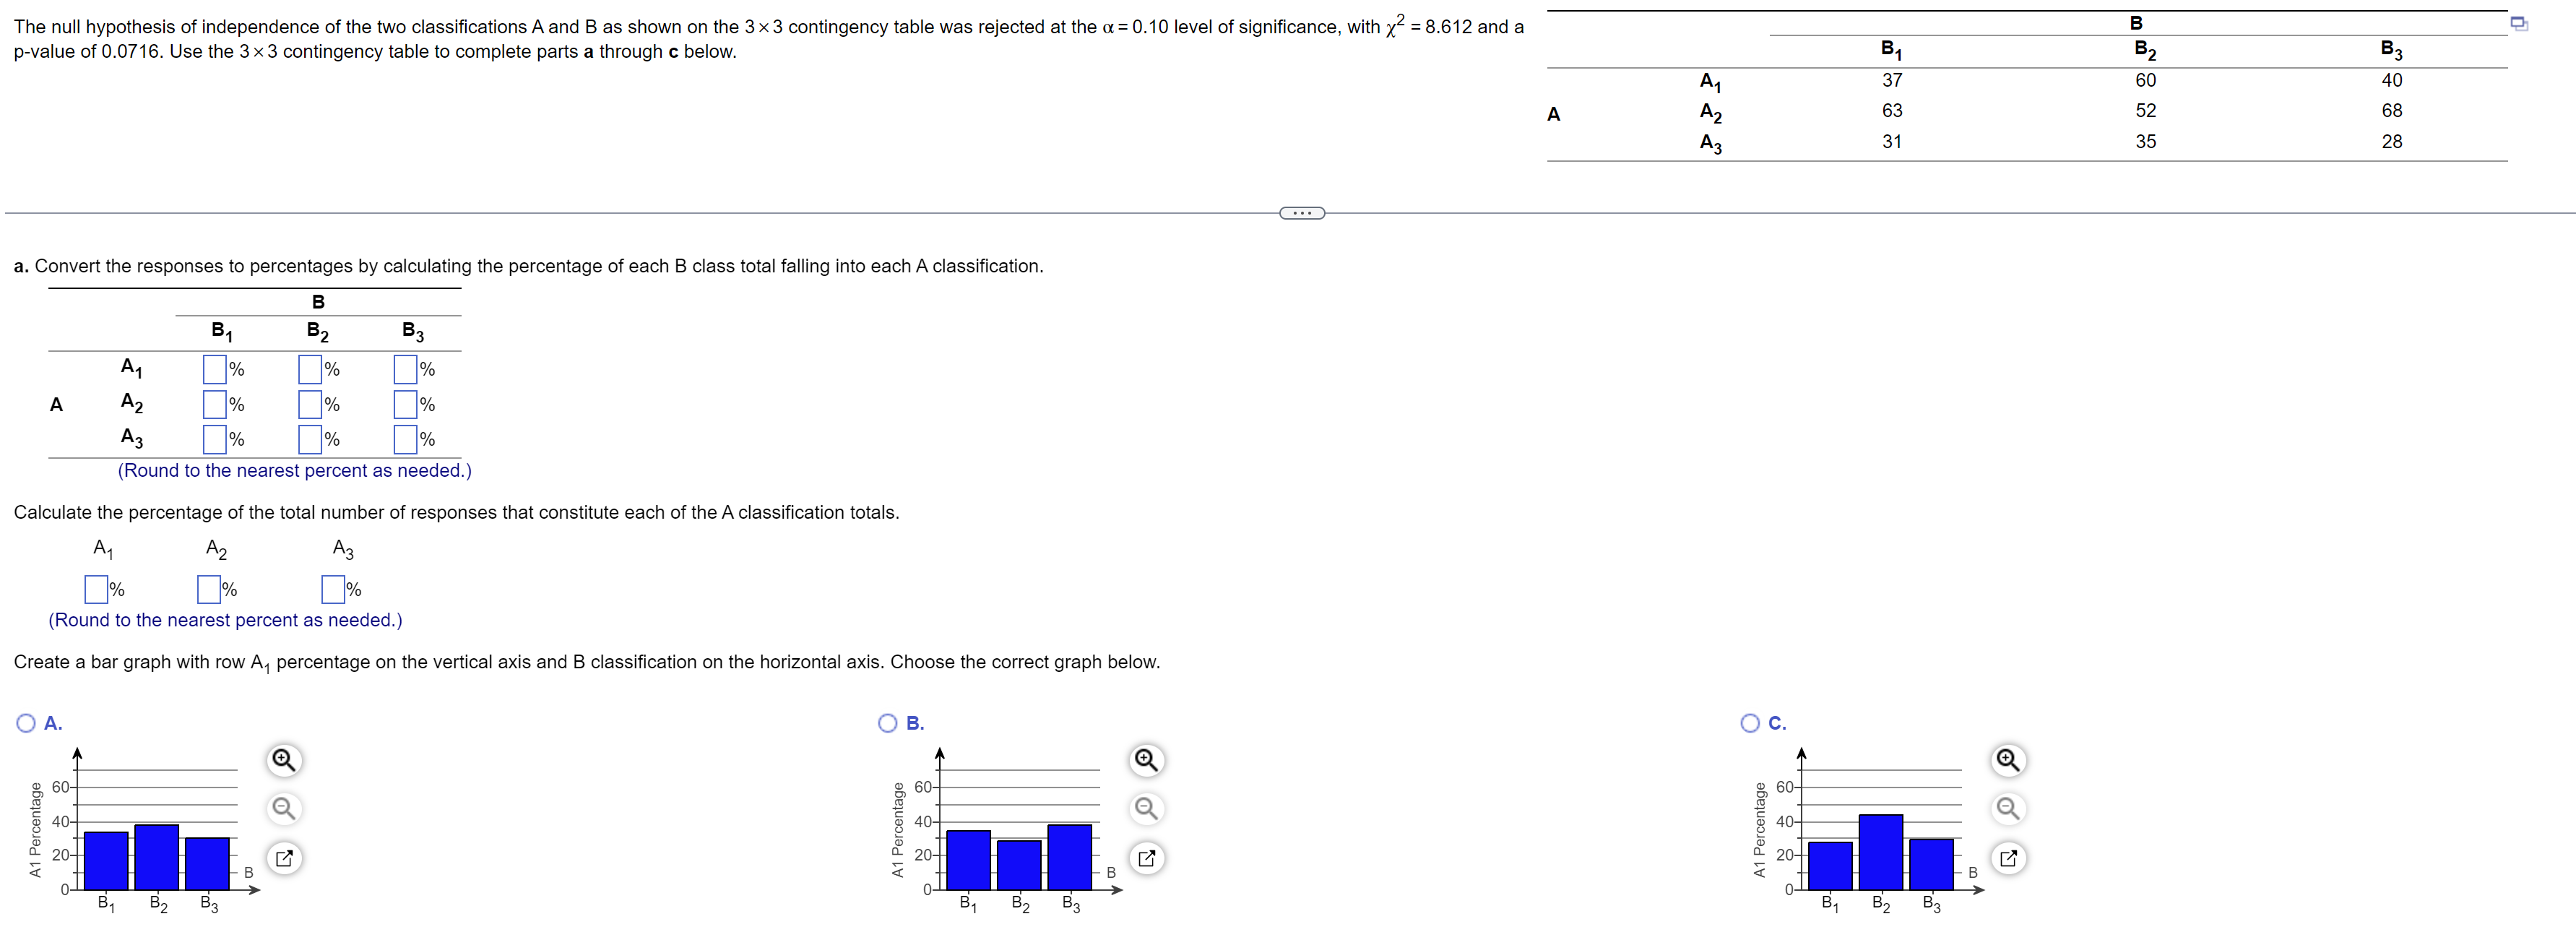
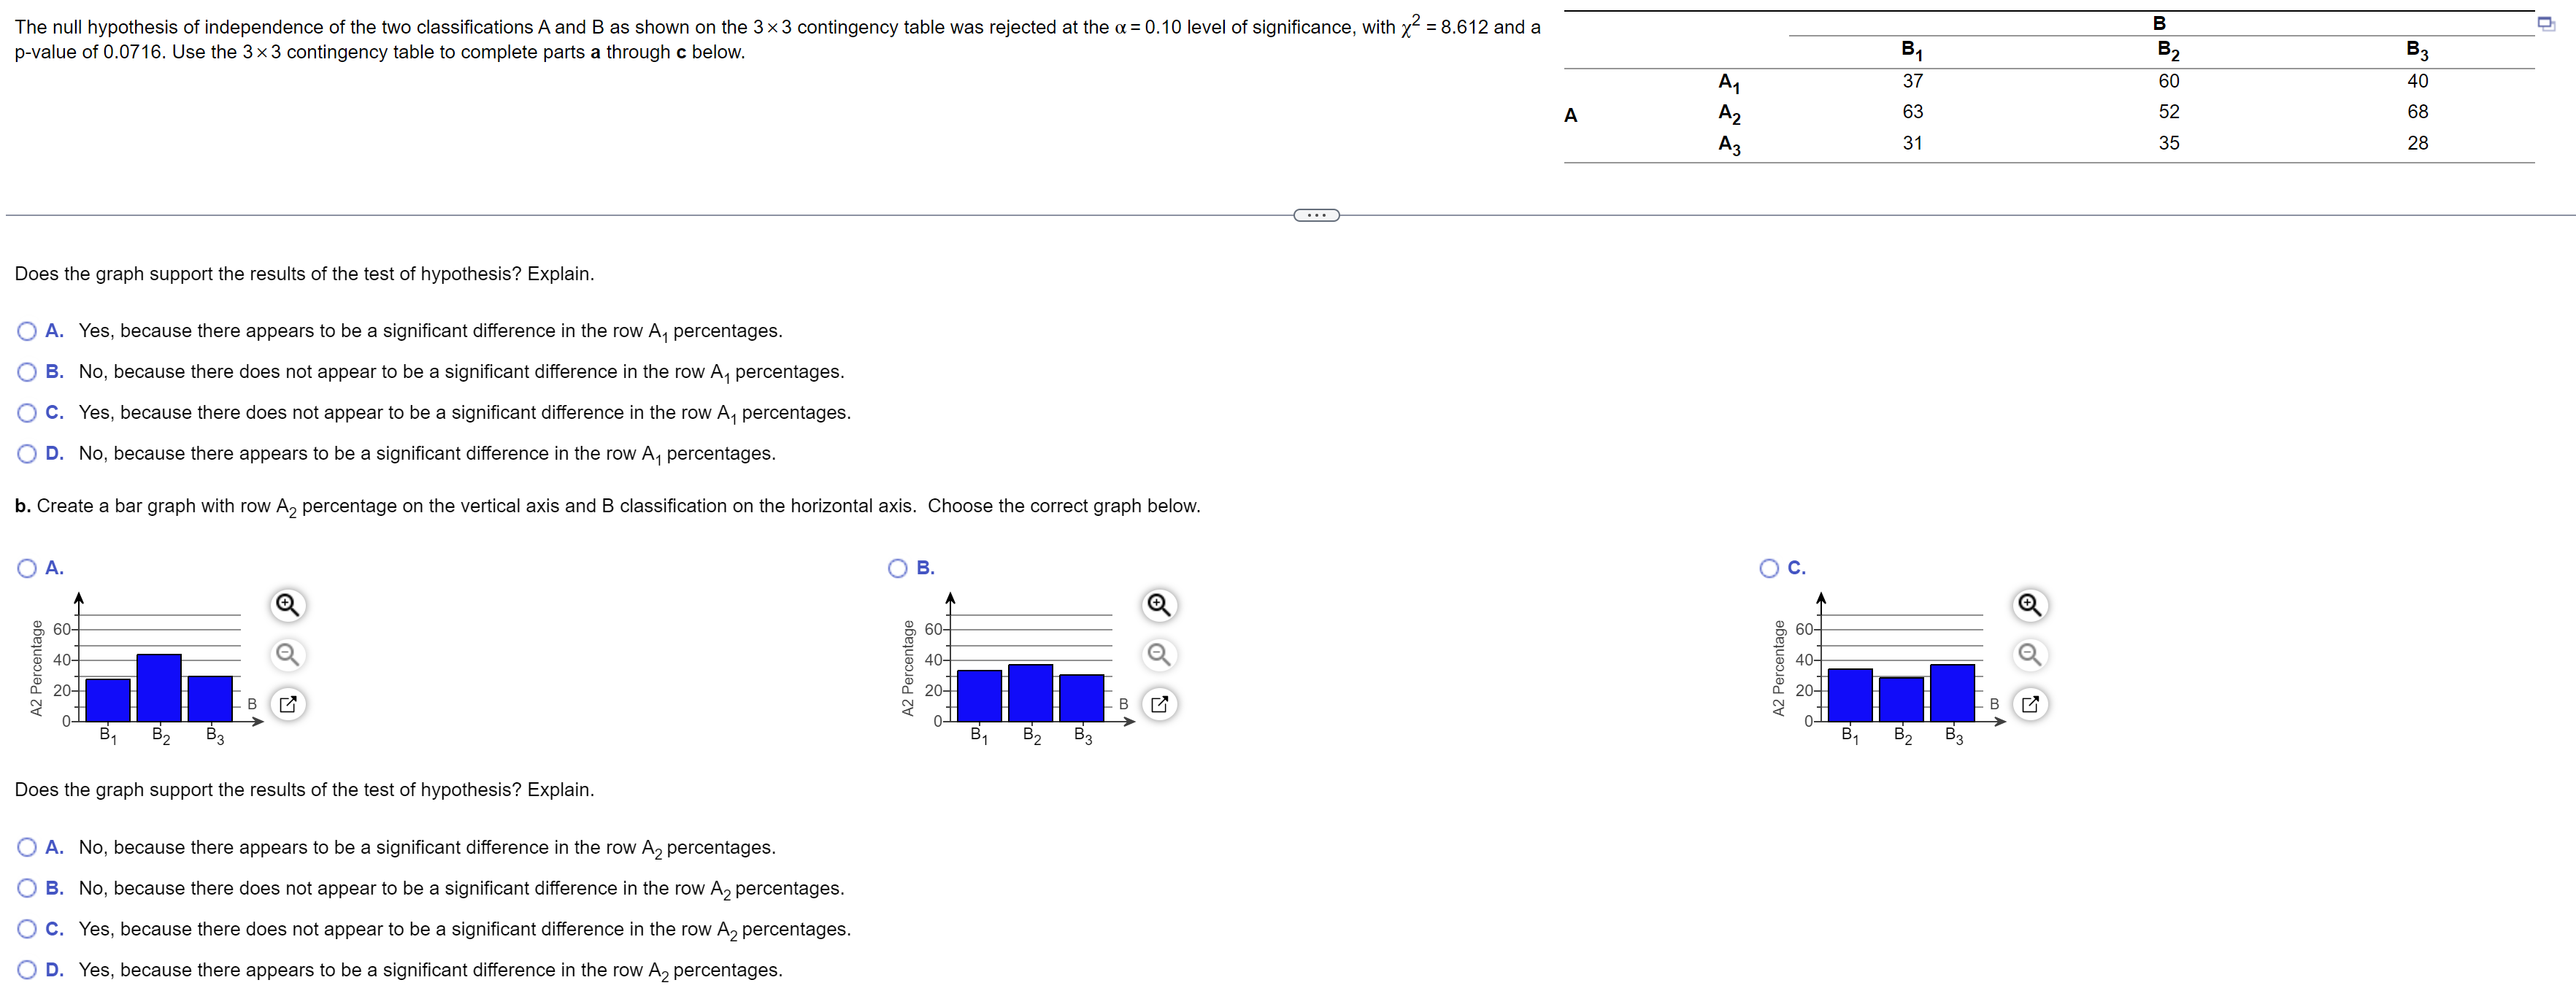
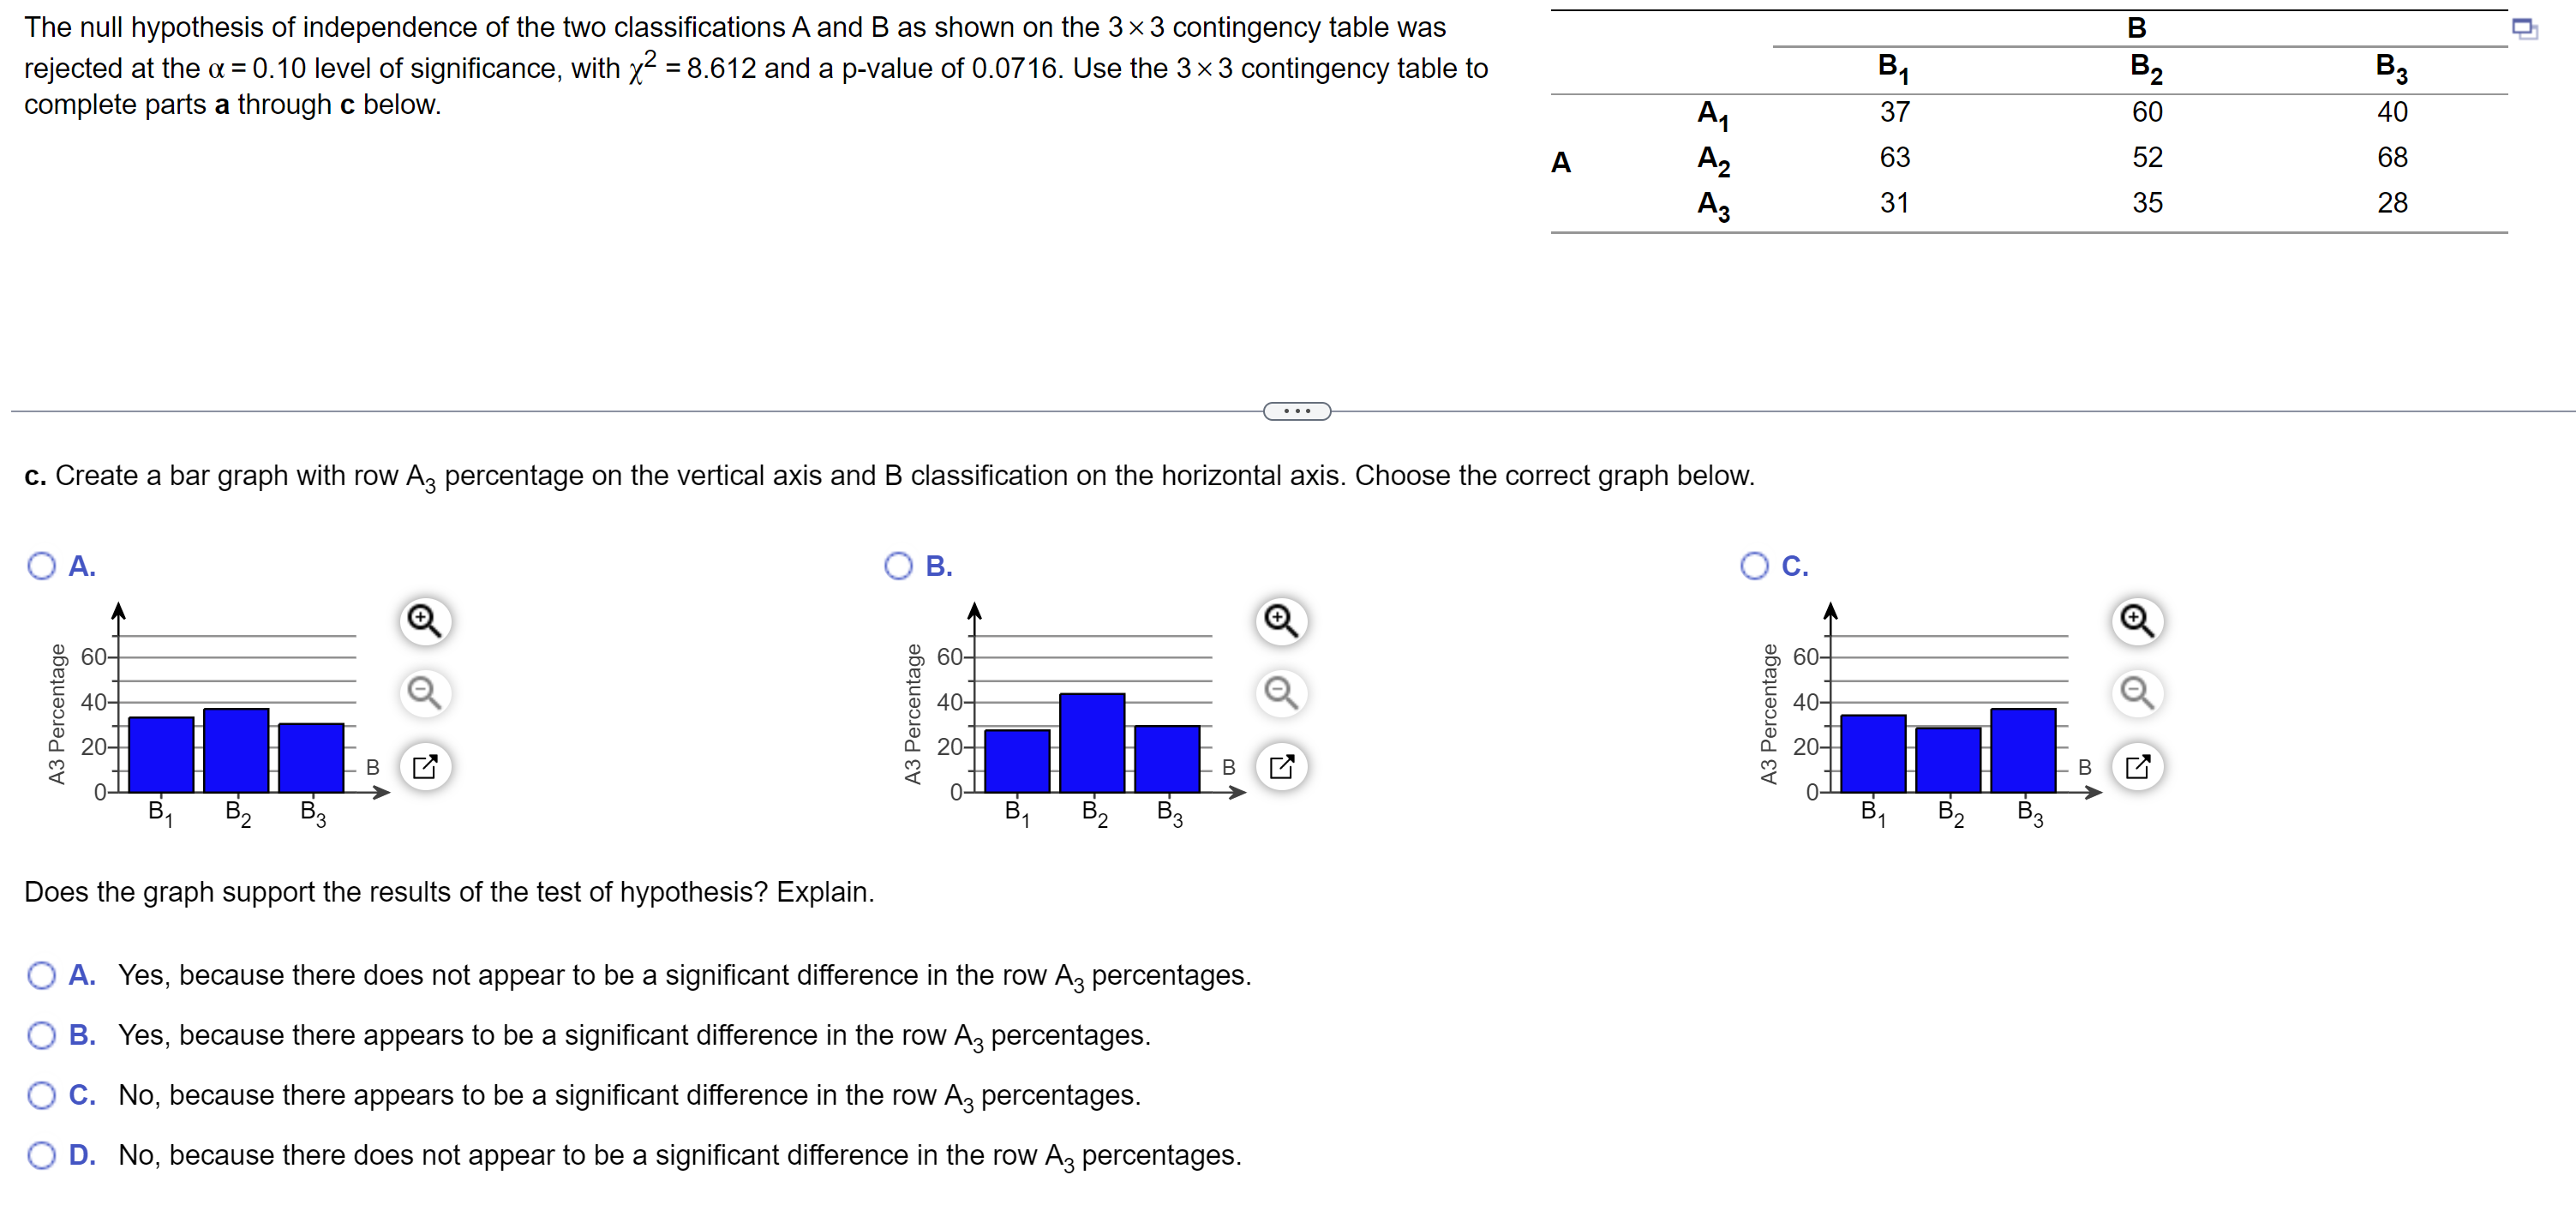
The null hypothesis of independence oi the two classications Aand B as shown on the 3x 3 contingency table was relected at the a = 0.10 level or significance. with x2 =8.612 and a prvalue of 0.0716. Use the 3x 3 contingency table to complete pans a through c below. 31 52 B; 37 60 40 63 52 as 31 35 28 a. Convert the responses to percentages by calculating the percentage of each B class total tailing into each Aclassmcation B 1 B2 3 A1 % % % A A2 % % % A3 % % % (Round to the nearest percent as needed.) Calculate the percentage of the total number oi responses that constitute each oitheA Classification totals. Al A2 A3 % % % (Round to the nearest percent as needed ) Create a bar graph with row A' percentage on the vertical axis and B classication on the horizontal axis, Choose the correct graph below. B. A Q A Q A Q g 507 g sue Q g 407 Q g 40' Q 51 E? 53 0 Bi 32 B3 0' Bl BE BS B B 2 B3 B1 The null hypothesis of independence of the two classifications A and B as shown on the 3 x 3 contingency table was rejected at the a = 0.10 level of significance, with x2 = 8.612 and a 37 60 40 A1 p-value of 0.0716. Use the 3 x 3 contingency table to complete parts a through c below. 63 52 68 A A2 35 28 A3 31 Does the graph support the results of the test of hypothesis? Explain. O A. Yes, because there appears to be a significant difference in the row A, percentages. O B. No, because there does not appear to be a significant difference in the row A, percentages. O C. Yes, because there does not appear to be a significant difference in the row A, percentages. O D. No, because there appears to be a significant difference in the row A, percentages. b. Create a bar graph with row A2 percentage on the vertical axis and B classification on the horizontal axis. Choose the correct graph below. O c. O B O A. Q A2 Percentage 60- A2 Percentage 40- A2 Percentage B 31 B 20- 31 D2 B3 31 B2 33 Does the graph support the results of the test of hypothesis? Explain. O A. No, because there appears to be a significant difference in the row A2 percentages. O B. No, because there does not appear to be a significant difference in the row A2 percentages. O C. Yes, because there does not appear to be a significant difference in the row A2 percentages. O D. Yes, because there appears to be a significant difference in the row A2 percentages.The null hypothesis of independence of the two classificationsAand B as shown on the 3 x3 contingency table was rejected at the or = 0.10 level of signicance, with X2 = 8.612 and a p-value of 0.0716. Use the 3 X 3 contingency table to B1 32 33 complete parts a through c below. A1 37 50 40 A A2 63 52 68 A3 31 35 28 c. Create a bar graph with row A3 percentage on the vertical axis and B classification on the horizontal axis. Choose the correct graph below. '1') A. i" B. J c. I Q 5 Q 5 Q \"g, 60 60 \"Rf, 60 5 4o 7 O\\ E 40: Q E 409 Q a a - a 0- 0 0- B1 BZ BB B1 BZ BS B1 Does the graph support the results of the test of hypothesis? Explain. . Yes, because there does not appear to be a significant difference in the row A3 percentages, . Yes, because there appears to be a significant difference in the row A3 percentages. . No, because there appears to be a significant difference in the row A3 percentages. '2: F D. No, because there does not appear to be a significant difference in the row A3 percentages
Step by Step Solution
There are 3 Steps involved in it
Step: 1
Get Instant Access to Expert-Tailored Solutions
See step-by-step solutions with expert insights and AI powered tools for academic success
Step: 2
Step: 3
Ace Your Homework with AI
Get the answers you need in no time with our AI-driven, step-by-step assistance