Answered step by step
Verified Expert Solution
Question
1 Approved Answer
The number of crime reported (in millions) and the number of arrest reported (in millions) by the department of justice for seven years are


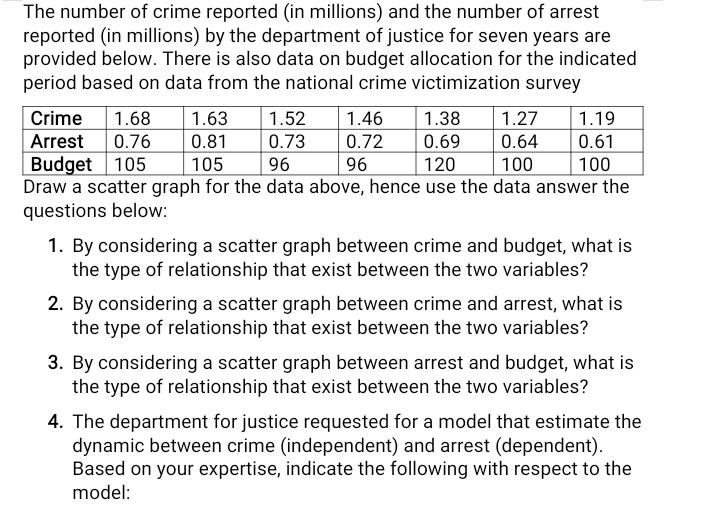
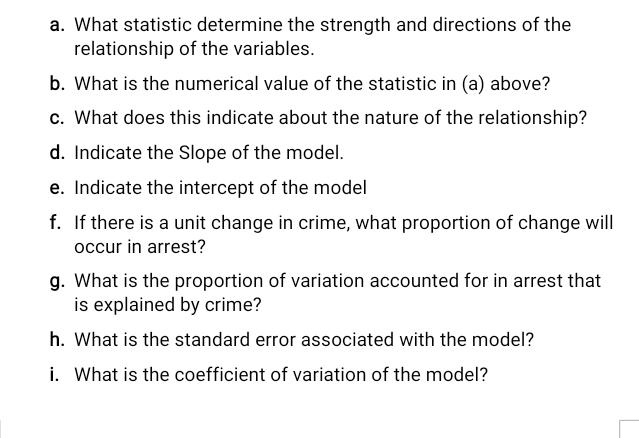
The number of crime reported (in millions) and the number of arrest reported (in millions) by the department of justice for seven years are provided below. There is also data on budget allocation for the indicated period based on data from the national crime victimization survey 1.63 1.52 1.46 1.38 1.27 0.81 0.69 0.64 0.73 0.72 96 105 96 120 100 Draw a scatter graph for the data above, hence use the data answer the questions below: Crime 1.68 Arrest 0.76 Budget 105 1.19 0.61 100 1. By considering a scatter graph between crime and budget, what is the type of relationship that exist between the two variables? 2. By considering a scatter graph between crime and arrest, what is the type of relationship that exist between the two variables? 3. By considering a scatter graph between arrest and budget, what is the type of relationship that exist between the two variables? 4. The department for justice requested for a model that estimate the dynamic between crime (independent) and arrest (dependent). Based on your expertise, indicate the following with respect to the model: a. What statistic determine the strength and directions of the relationship of the variables. b. What is the numerical value of the statistic in (a) above? c. What does this indicate about the nature of the relationship? d. Indicate the Slope of the model. e. Indicate the intercept of the model f. If there is a unit change in crime, what proportion of change will occur in arrest? g. What is the proportion of variation accounted for in arrest that is explained by crime? h. What is the standard error associated with the model? i. What is the coefficient of variation of the model?
Step by Step Solution
★★★★★
3.46 Rating (156 Votes )
There are 3 Steps involved in it
Step: 1
To draw a scatter graph for the given data well plot the number of crimes reported on the xaxis and the corresponding variable budget allocation or nu...
Get Instant Access to Expert-Tailored Solutions
See step-by-step solutions with expert insights and AI powered tools for academic success
Step: 2

Step: 3

Ace Your Homework with AI
Get the answers you need in no time with our AI-driven, step-by-step assistance
Get Started


