Answered step by step
Verified Expert Solution
Link Copied!

Question

1 Approved Answer

The number ofassaults in a city is depicted in two different graphs below. Assault Counts Graph A Assault Counts Graph B 300 290 280 270
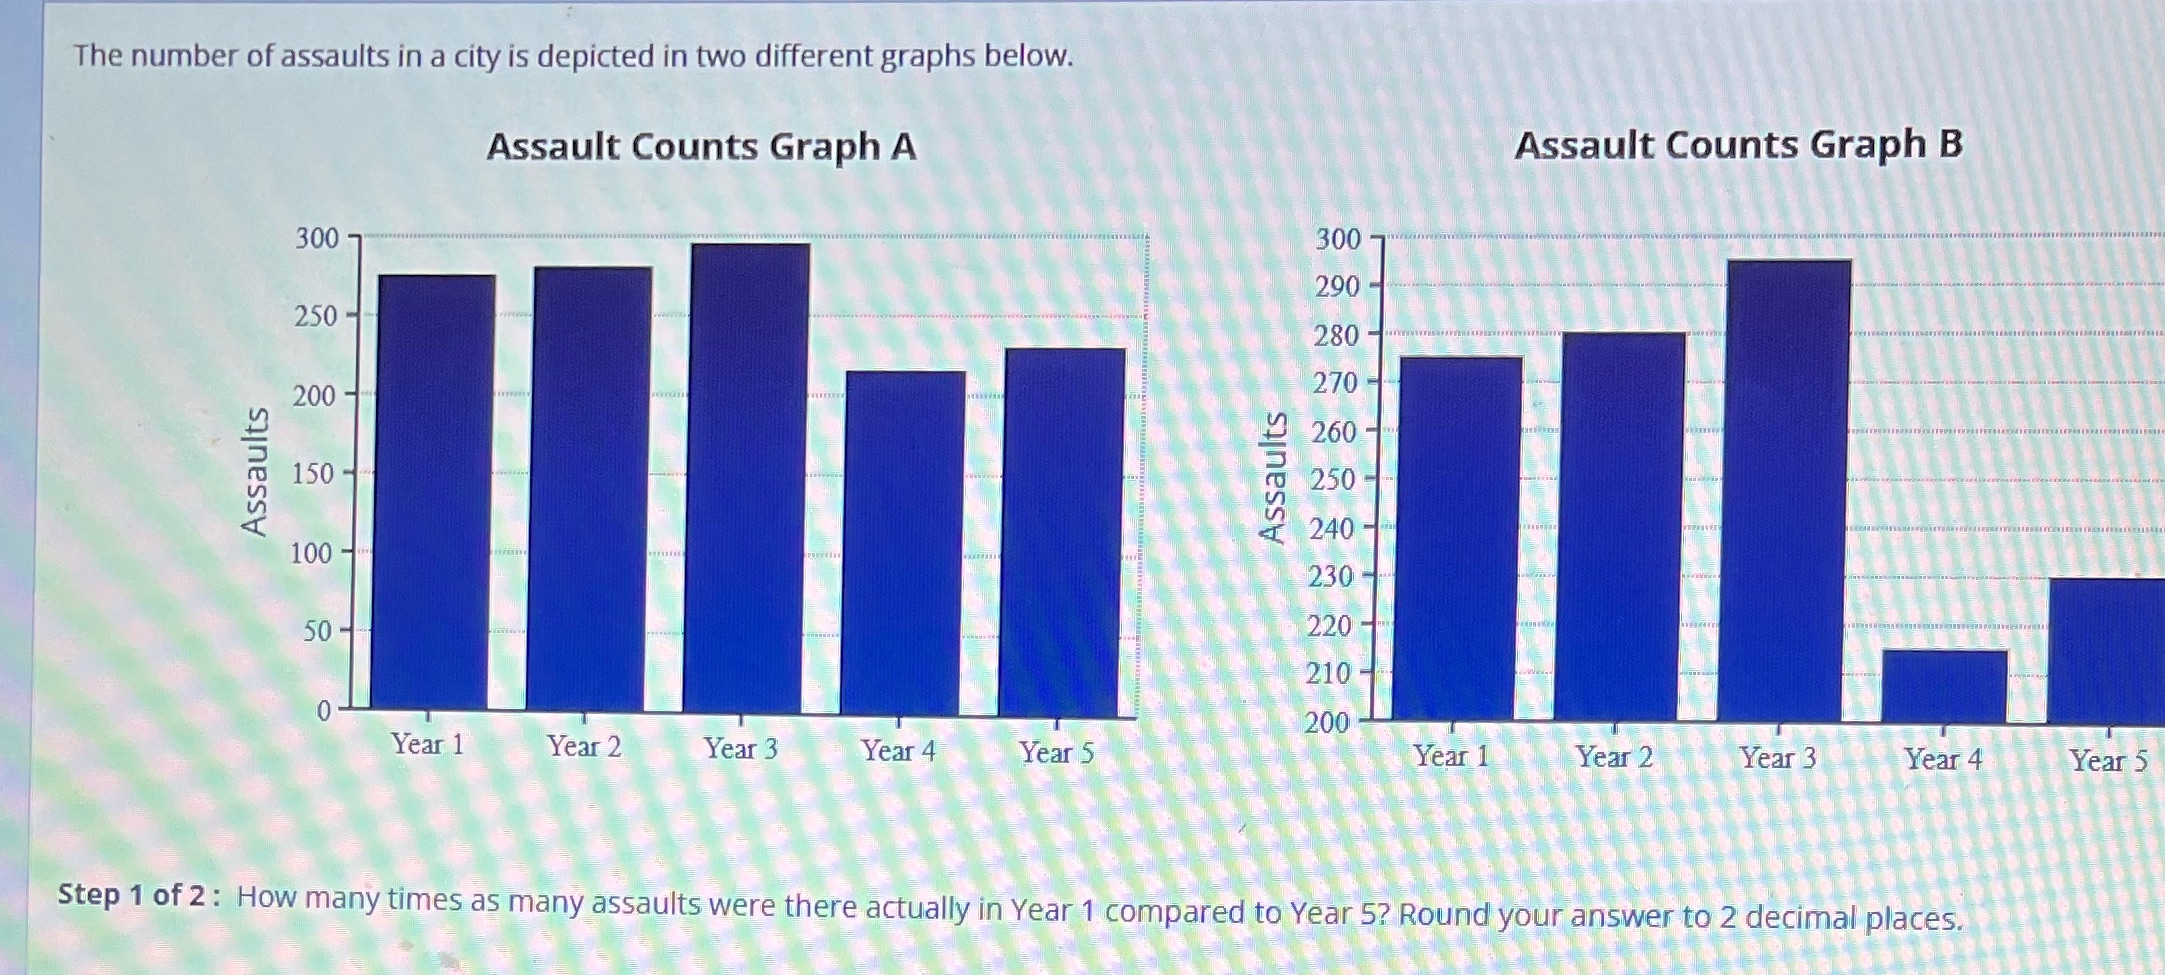
image text in transcribed
The number ofassaults in a city is depicted in two different graphs below. Assault Counts Graph A Assault Counts Graph B 300 290 280 270 260 250 240 230' 220 210 ' Y . ' 200' l ear 1 Year 2 Year 3 Year 4 Year 5 Year 1 Year 2 Year 3 Year 4 Year 5 Assaults Assaults Step 1 of2: How many times as many assaults were there actually In Year 1 compared to Year 5? Round your answer to 2 decimal places

Step by Step Solution

There are 3 Steps involved in it

Step: 1

blur-text-image

Get Instant Access to Expert-Tailored Solutions

See step-by-step solutions with expert insights and AI powered tools for academic success

Step: 2

blur-text-image_2

Step: 3

blur-text-image_3

Ace Your Homework with AI

Get the answers you need in no time with our AI-driven, step-by-step assistance

Get Started

Recommended Textbook for

Probability and Random Processes With Applications to Signal Processing and Communications

Authors: Scott Miller, Donald Childers

2nd edition

123869811, 978-0121726515, 121726517, 978-0130200716, 978-0123869814

More Books

Students also viewed these Mathematics questions