Question
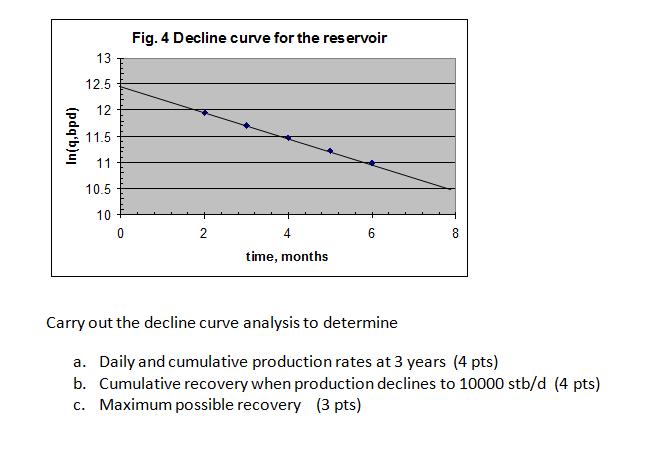
The oil production rate history of an oil reservoir is given in the table below and plotted in Fig.4: production time, months rate, stb/d


The oil production rate history of an oil reservoir is given in the table below and plotted in Fig.4: production time, months rate, stb/d In(q) 10 15 154700 11.94924304 121700 11.70931428 95700 11.46897358 || 20 25 75300 11.22923541 30 59200 10.98867682 Fig. 4 Decline curve for the reservoir 12.5 12 11.5 11 10.5 10 time, months Carry out the decline curve analysis to determine a. Daily and cumulative production rates at 3 years (4 pts) b. Cumulative recovery when production declines to 10000 stb/d (4 pts) c. Maximum possible recovery (3 pts) 3. (pdq'b)uj
Step by Step Solution
3.48 Rating (178 Votes )
There are 3 Steps involved in it
Step: 1
0 Given data 221 2 Dit Di Declinerate r 7 final Flowrate Drital flowrente t ...
Get Instant Access to Expert-Tailored Solutions
See step-by-step solutions with expert insights and AI powered tools for academic success
Step: 2

Step: 3

Ace Your Homework with AI
Get the answers you need in no time with our AI-driven, step-by-step assistance
Get StartedRecommended Textbook for
Introductory Statistics
Authors: Prem S. Mann
8th Edition
9781118473986, 470904100, 1118473981, 978-0470904107
Students also viewed these Physics questions
Question
Answered: 1 week ago
Question
Answered: 1 week ago
Question
Answered: 1 week ago
Question
Answered: 1 week ago
Question
Answered: 1 week ago
Question
Answered: 1 week ago
Question
Answered: 1 week ago
Question
Answered: 1 week ago
Question
Answered: 1 week ago
Question
Answered: 1 week ago
Question
Answered: 1 week ago
Question
Answered: 1 week ago
Question
Answered: 1 week ago
Question
Answered: 1 week ago
Question
Answered: 1 week ago
Question
Answered: 1 week ago
Question
Answered: 1 week ago
Question
Answered: 1 week ago
Question
Answered: 1 week ago
Question
Answered: 1 week ago
Question
Answered: 1 week ago
Question
Answered: 1 week ago
Question
Answered: 1 week ago
View Answer in SolutionInn App


