The ones in green are correct. needing assistance with the rest. thank you Consider the tabled revenue and cost data to the right. Answer the
The ones in green are correct. needing assistance with the rest. thank you
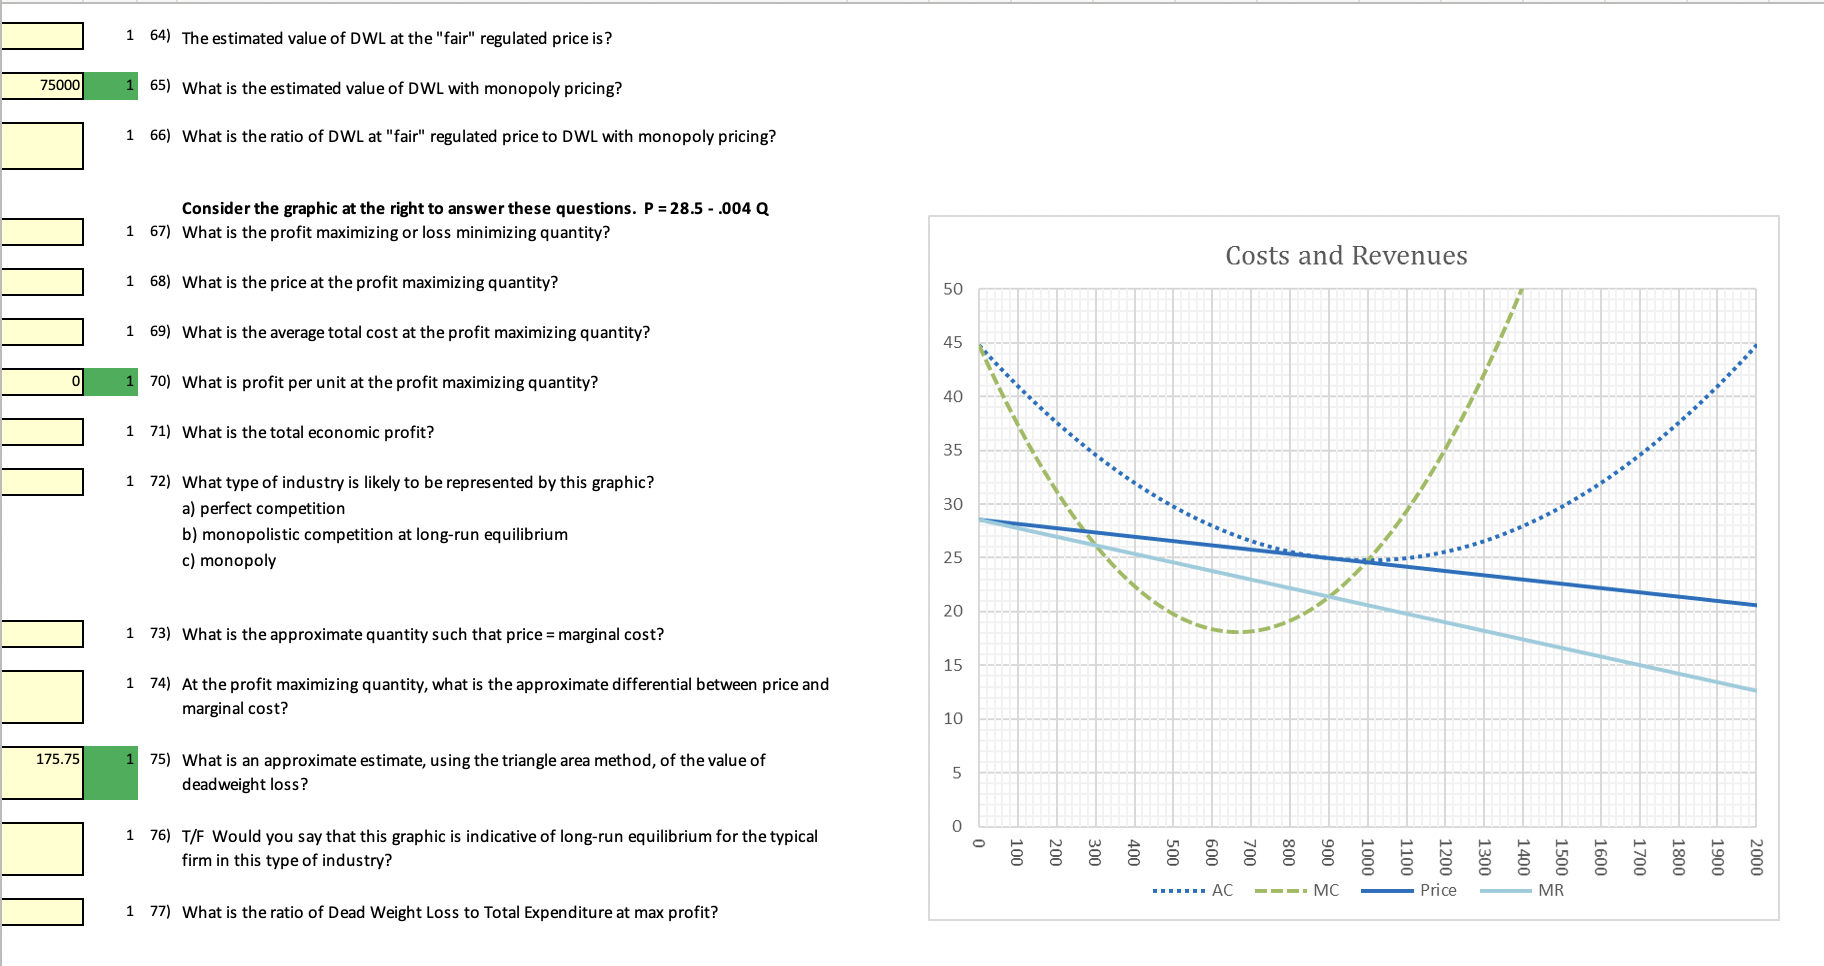
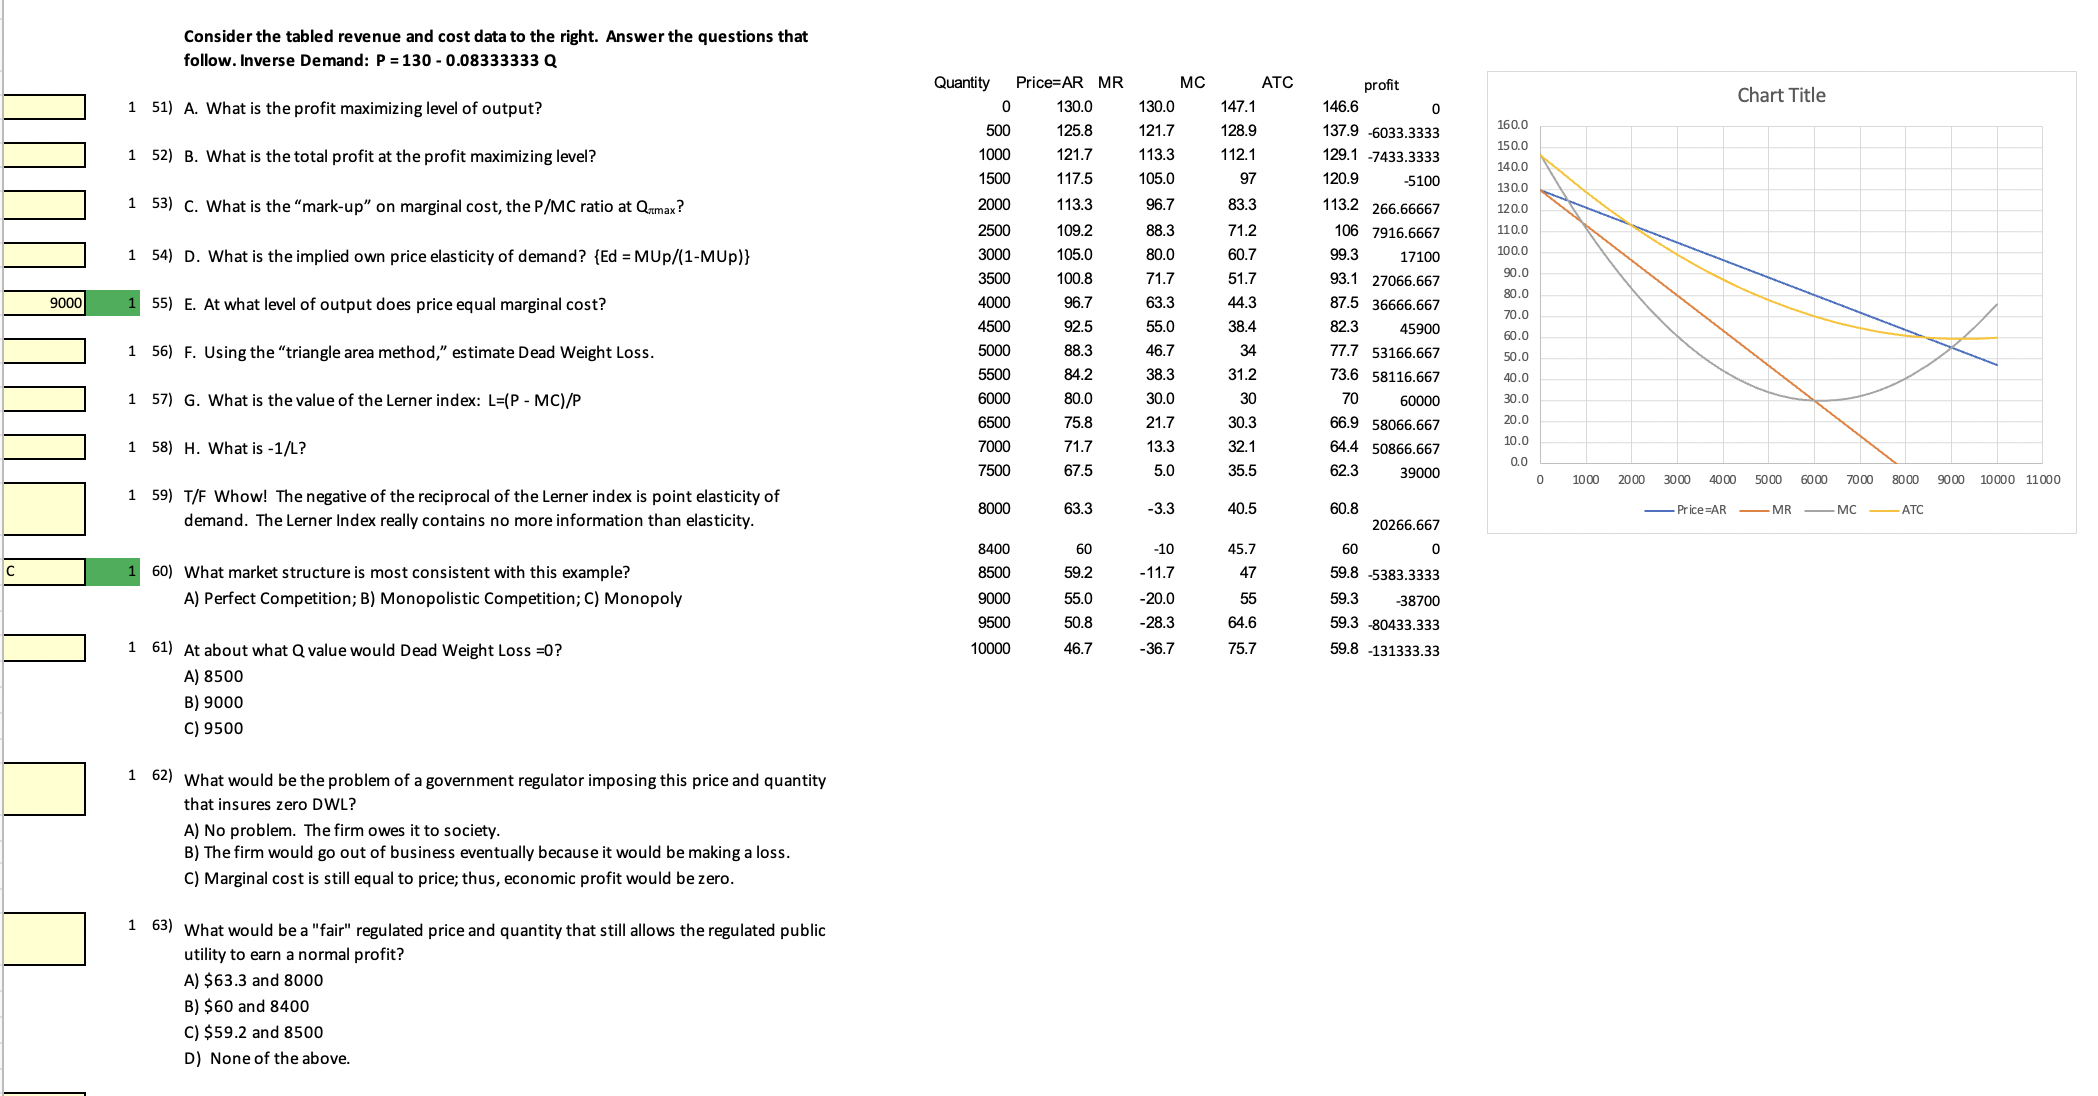
Consider the tabled revenue and cost data to the right. Answer the questions that follow. Inverse Demand: P =130 - 0.08333333 Q Quantity Price=AR MR MC ATC profit Chart Title C 130.0 130.0 147.1 146.6 1 51) A. What is the profit maximizing level of output? 500 125.8 121.7 28.9 137.9 -6033.3333 160.0 150.0 1000 121.7 113.3 112.1 1 52) B. What is the total profit at the profit maximizing level? 29.1 -7433.3333 140.0 1500 117.5 105.0 97 120.9 -5100 130.0 83.3 1 53) C. What is the "mark-up" on marginal cost, the P/MC ratio at Qumax? 2000 113.3 96.7 113.2 266.66667 120.0 2500 109.2 88.3 71.2 106 7916.6667 110.0 1 54) D. What is the implied own price elasticity of demand? {Ed = MUp/(1-MUp)} 3000 105.0 80.0 60.7 99.3 17100 100.0 3500 100.8 71.7 51.7 93.1 27066.667 90.0 80.0 55) E. At what level of output does price equal marginal cost? 1000 96.7 63.3 44.3 87.5 36666.667 9000 70.0 4500 92.5 55.0 38.4 82.3 45900 60.0 88.3 46.7 34 1 56) F. Using the "triangle area method," estimate Dead Weight Loss. 5000 77.7 53166.667 50.0 5500 84.2 38.3 31.2 73.6 58116.667 40.0 1 57) G. What is the value of the Lerner index: L=(P - MC)/P 6000 80.0 30.0 30 70 60000 30.0 $500 75.8 21.7 30.3 66.9 58066.667 20.0 7000 71.7 13.3 32.1 64.4 50866.667 10.0 1 58) H. What is -1/L? 0.0 7500 67.5 5.0 35.5 62.3 39000 0 2000 3000 4000 5000 6000 7000 8000 9000 10000 11000 59) T/F Whow! The negative of the reciprocal of the Lerner index is point elasticity of 8000 63.3 -3.3 40 5 60.8 - Price=AR - MR - MC - ATC demand. The Lerner Index really contains no more information than elasticity. 20266.667 3400 50 -10 45.7 60 60) What market structure is most consistent with this example? 3500 59.2 -11.7 47 59.8 -5383.3333 A) Perfect Competition; B) Monopolistic Competition; C) Monopoly 9000 55.0 20.0 55 59.3 -38700 3500 50.8 28.3 64.6 59.3 -80433.333 10000 16 7 36.7 75.7 59.8 -131333.33 1 61) At about what Q value would Dead Weight Loss =0? A) 8500 B) 9000 C) 9500 1 62) What would be the problem of a government regulator imposing this price and quantity that insures zero DWL? A) No problem. The firm owes it to society. B) The firm would go out of business eventually because it would be making a loss. C) Marginal cost is still equal to price; thus, economic profit would be zero. 1 63) What would be a "fair" regulated price and quantity that still allows the regulated public utility to earn a normal profit? A) $63.3 and 8000 B) $60 and 8400 C) $59.2 and 8500 D) None of the above.75000 - 54) 55) 66) 57) 53) 59) 7o) 71) 72) 73) 74) 75) 76) 77) The estimated value of DWL at the "fair" regulated price is? What is the estimated value of DWL with monopoly pricing? What is the ratio of DWL at "fair" regulated price to DWL with monopoly pricing? Consider the graphic at the right to answer these questions. P = 28.5 - .004 Q What is the profit maximiling or loss minimiling quantity? What is the price at the prot maximiiing quantity? wh at is the average total cost at the profit maximiling quantity? What is profit per unit at the profit maximizing quantity? What is the total economic profit? What type of industry is likely to be represented by this graphic? a] perfect competition b] monopolistic competition atlongerun equilibrium c] monopoly What is the approximate quantity such that price = marginal cost? At the profit maximizing quantity, what is the approximate differential between price and marginal cost? What is an approximate estimate. using the triangle area method. of the value of deadweight loss? T/F Would you say that this graphic is indicative of longerun equilibrium forthetypical firm in this type of industry? What is the ratio of Dead Weight Loss to Total Expenditure at max profit? 50 45 4O 35 3O 25 7O 15 10 001 (JOE 0013 007 AC Costs and Revenues w m \D pa pa P D O D D H M D O D D O D a a a MC Price OOSI 00H '3 0091 0091 UOLI 0031 0061 0003
Step by Step Solution
There are 3 Steps involved in it
Step: 1
Get Instant Access to Expert-Tailored Solutions
See step-by-step solutions with expert insights and AI powered tools for academic success
Step: 2
Step: 3
Ace Your Homework with AI
Get the answers you need in no time with our AI-driven, step-by-step assistance