The only part of this problem I am struggling with is the last part. Number 3, A and B. Figuring out how if Northerns average
The only part of this problem I am struggling with is the last part. Number 3, A and B. Figuring out how if Northerns average age gets to 20,000 hours, how much will the airframe maintenance costs, and the engine maintenance costs be and Southeast's average age getting to 12,000 hours, what would the engine maintenance costs be and the airframe maintenance costs be?
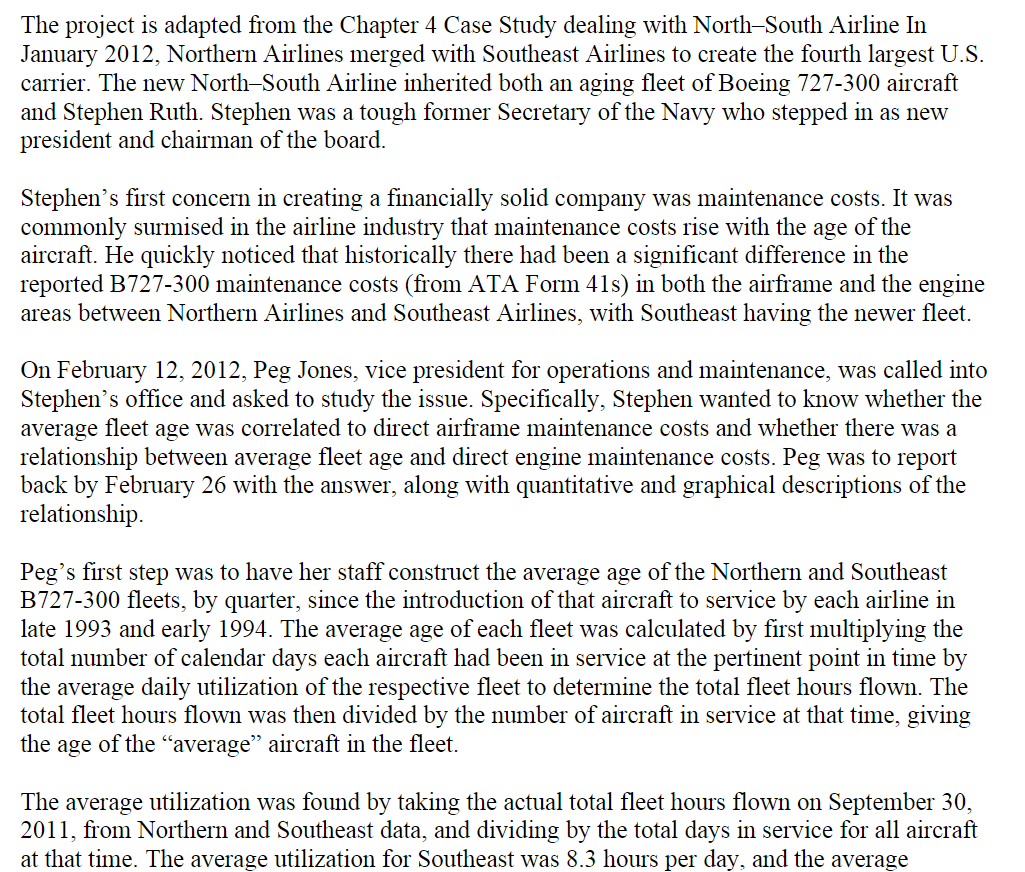
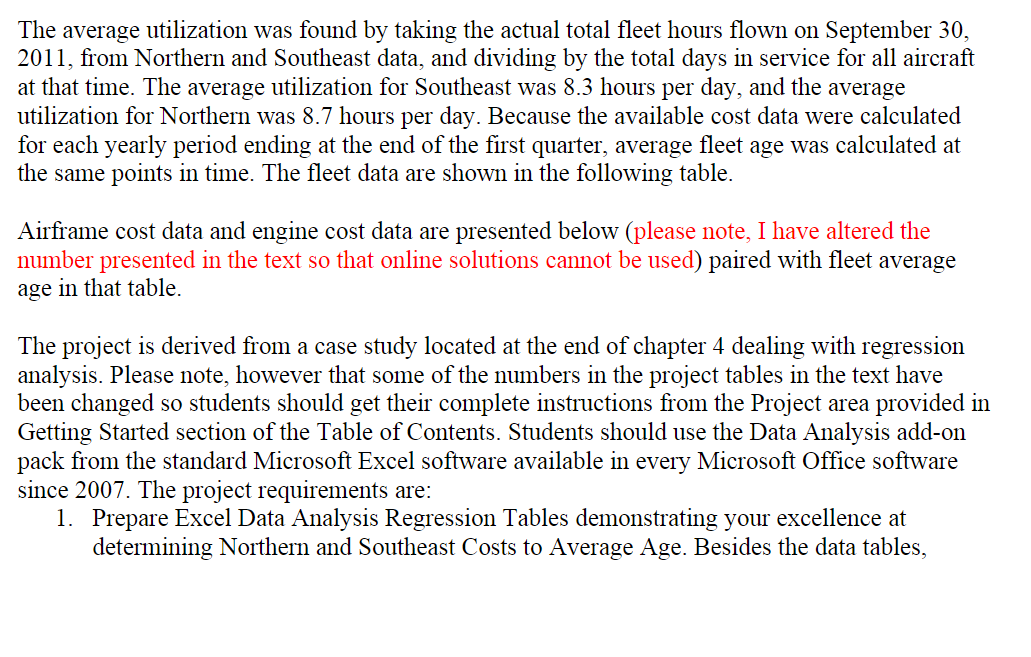
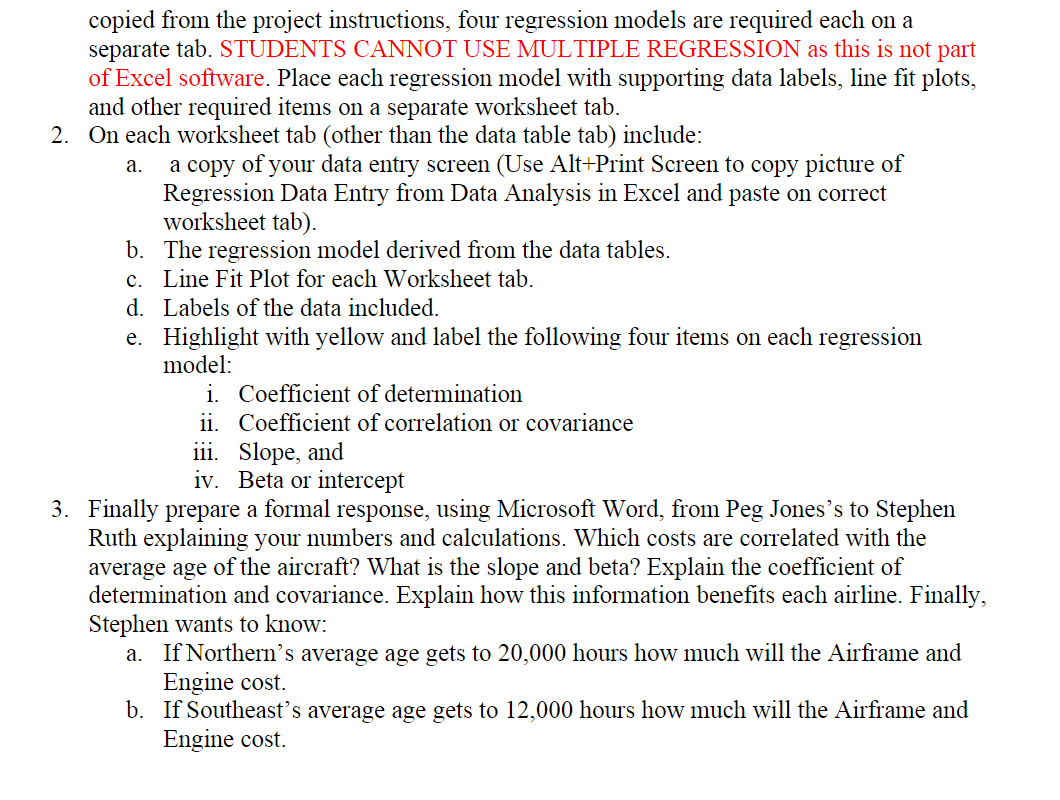
The project is adapted from the Chapter 4 Case Study dealing with North South Airline In January 2012, Northern Airlines merged with Southeast Airlines to create the fourth largest U.S. carrier. The new North-South Airline inherited both an aging fleet of Boeing 727-300 aircraft and Stephen Ruth. Stephen was a tough former Secretary of the Navy who stepped in as new president and chairman of the board. Stephen's first concern in creating a financially solid company was maintenance costs. It was commonly surmised in the airline industry that maintenance costs rise with the age of the aircraft. He quickly noticed that historically there had been a significant difference in the reported B727-300 maintenance costs (from ATA Form 41s) in both the airframe and the engine areas between Northern Airlines and Southeast Airlines, with Southeast having the newer fleet. On February 12, 2012, Peg Jones, vice president for operations and maintenance, was called into Stephen's office and asked to study the issue. Specifically, Stephen wanted to know whether the average fleet age was correlated to direct airframe maintenance costs and whether there was a relationship between average fleet age and direct engine maintenance costs. Peg was to report back by February 26 with the answer, along with quantitative and graphical descriptions of the relationship Peg's first step was to have her staff construct the average age of the Northern and Southeast B727-300 fleets, by quarter, since the introduction of that aircraft to service by each airline in late 1993 and early 1994. The average age of each fleet was calculated by first multiplying the total number of calendar days each aircraft had been in service at the pertinent point in time by the average daily utilization of the respective fleet to determine the total fleet hours flown. The total fleet hours flown was then divided by the number of aircraft in service at that time, giving the age of the "average" aircraft in the fleet. The average utilization was found by taking the actual total fleet hours flown on September 30, 2011, from Northern and Southeast data, and dividing by the total days in service for all aircraft at that time. The average utilization for Southeast was 8.3 hours per day, and the averageThe average utilization was found by taking the actual total eet hours own on September 30,, 2011, from Northern and Southeast data, and dividing by the total days in service for all aircraft at that time. The average utilization for Southeast was 8.3 hours per day, and the average utilization for Northern was 8.7 hours per day. Because the available cost data were calculated for each yearly period ending at the end of the rst quarter, average eet age was calculated at the same points in time. The eet data are shown in the following table. Airframe cost data and engine cost data are presented below (please note, I have altered the number presented in the text so that online solutions cannot be used) paired with eet average age in that table. The project is derived from a case study located at the end of chapter 4 dealing with regression analysis. Please note: however that some of the numbers in the project tables in the text have been changed so students should get their complete instructions from the Project area provided in Getting Started section of the Table of Contents. Students should use the Data Analysis add-on pack front the standard Microsoft Excel software available in every Microsoft Office software since 2007. The project requirements are: 1. Prepare Excel Data Analysis Regression Tables demonstrating your excellence at determining Nolthern and Southeast Costs to Average Age. Besides the data tables, Ix.) Lu copied from the project instructions, four regression models are required each on a separate tab. STUDENTS CANNOT USE MULTIPLE REGRESSION as this is not part of Excel software. Place each regression model with supporting data labels, line fit plots, and other required items on a separate worksheet tab. On each worksheet tab (other than the data table tab) include: a. a copy of your data entry screen (Use Alt+Print Screen to copy picture of Regression Data Entry from Data Analysis in Excel and paste on correct worksheet tab). The regression model derived from the data tables. Line Fit Plot for each Worksheet tab. Labels of the data included. Highlight with yellow and label the following four items on each regression model: i. Coefcient of determination ii. Coefcient of correlation or covariance iii. Slope, and iv. Beta or intercept Finally prepare a formal response, using Microsoft Word, from Peg Jones's to Stephen Ruth explaining your numbers and calculations. Which costs are correlated with the average age of the aircraft? What is the slope and beta? Explain the coefficient of determination and covariance. Explain how this information benefits each airline. Finally, Stephen wants to know: a. If Northern's average age gets to 20,000 hours how much will the Airframe and Engine cost. b. If Southeast's average age gets to 12,000 hours how much will the Airframe and Engine cost. pangs? Northern Airline Data (numbers have been changed from text) Airframe Cost Engine Cost Average Age Year per Aircraft per Aircraft (Hours) 2001 61.80 33.49 6,512 2002 54.92 38.58 8,404 2003 69.70 51.48 11,077 2004 68.90 58.72 11,717 2005 63.72 45.47 13,275 2006 84.73 50.26 15,215 2007 78.74 80.60 18,390Southeast Airline Data (numbers have been changed from text) Airframe Cost Engine Cost Average Age Year Per Aircraft per Aircraft (Hours) 2001 14.29 19.86 5,107 2002 25.15 31.55 8,145 2003 32.18 40.43 7,360 2004 31.78 22.10 5,773 2005 25.34 19.69 7,150 2006 32.78 32.58 9,364 2007 35.56 37.07 8,259
Step by Step Solution
There are 3 Steps involved in it
Step: 1
Get Instant Access to Expert-Tailored Solutions
See step-by-step solutions with expert insights and AI powered tools for academic success
Step: 2
Step: 3
Ace Your Homework with AI
Get the answers you need in no time with our AI-driven, step-by-step assistance