Answered step by step
Verified Expert Solution
Question
1 Approved Answer
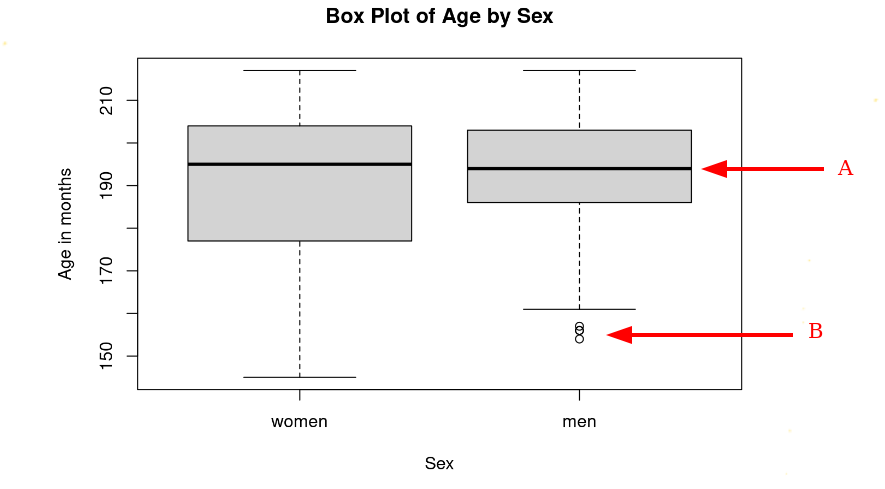
The options to label A and B are: (check the module Data Visualizations on Canvas) 1) A.Regression line, B.Outliers 2) A.Mean, B.Median 3) A.Median, The
- The options to label A and B are: (check the module "Data Visualizations on Canvas")
1) A.Regression line, B.Outliers
2) A.Mean, B.Median
3) A.Median, The options to label A and B are: (check the module "Data Visualizations on Canvas")

Step by Step Solution
There are 3 Steps involved in it
Step: 1

Get Instant Access to Expert-Tailored Solutions
See step-by-step solutions with expert insights and AI powered tools for academic success
Step: 2

Step: 3

Ace Your Homework with AI
Get the answers you need in no time with our AI-driven, step-by-step assistance
Get Started


