The output needed for this question is given at the end of this test paper (see last page]. a] Based on the output, explain what
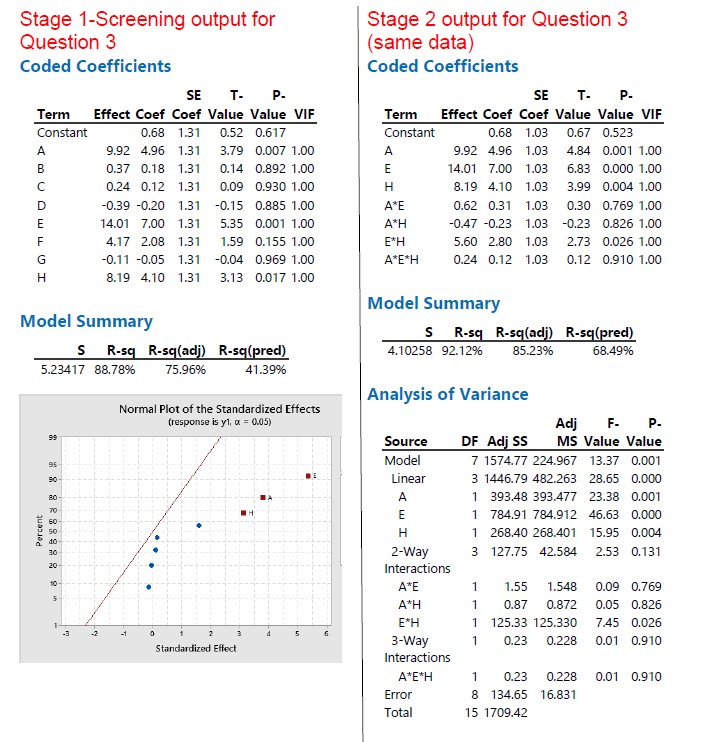
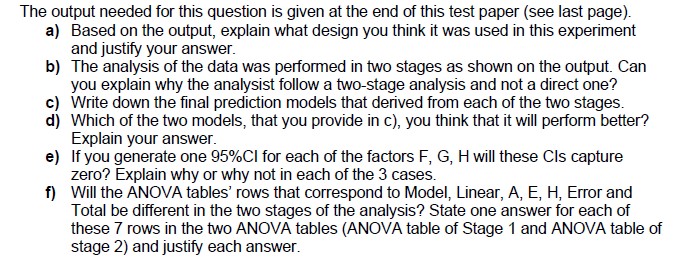
The output needed for this question is given at the end of this test paper (see last page]. a] Based on the output, explain what design you think it was used in this experiment and justify your answer. b} The analysis of the data was performed in two stages as shown on the output. lGan you explain why the anatysist follow a two-stage analysis and not a direct one? c] Write down the nal prediction models that derived from each of the two stages. d} Which of the two models, that you provide in c), you think that it will perform better? Explain your answer. e] If you generate one 95%Cl for each of the factors F, G, H will these Cls capture zero? Explain why orwhy not in each of the 3 cases. f] Will the ANOVA tables' rows that corTespond to Model, Linear, A, E, H, Enor and Total be different in the two stages of the analysis? State one answer for each of these 7 rows in the two ANOVA tables {ANOVA table of Stage 1 and ANOVA table of stage 2} and justify each answer. Stage 1-Screening output for Stage 2 output for Question 3 Question 3 (same data) Coded Coefficients Coded Coefficients SE T - P- SE T- P- Term Effect Coef Coef Value Value VIF Term Effect Coef Coef Value Value VIF Constant 0.68 1.31 0.52 0.617 Constant 0.68 1.03 0.67 0.523 A 9.92 4.96 1.31 3.79 0.007 1.00 A 9.92 4.96 1.03 4.84 0.001 1.00 0.37 0.18 1.31 0.14 0.892 1.00 E 14.01 7.00 1.03 6.83 0.000 1.00 0.24 0.12 1.31 0.09 0.930 1.00 H 8.19 4.10 1.03 3.99 0.004 1.00 -0.39 -0.20 1.31 -0.15 0.885 1.00 A*E 0.62 0.31 1.03 0.30 0.769 1.00 14.01 7.00 1.31 5.35 0.001 1.00 A*H -0.47 -0.23 1.03 -0.23 0.826 1.00 1.59 0.155 1.00 *H 5.60 2.80 1.03 2.73 0.026 1.00 IATM 4.17 2.08 1.31 -0.11 -0.05 1.31 -0.04 0.969 1.00 A*E* H 0.24 0.12 1.03 0.12 0.910 1.00 8.19 4.10 1.31 3.13 0.017 1.00 Model Summary Model Summary S R-sq R-sq(adj) R-sq(pred) S R-sq R-sq(adj) R-sq(pred) 4.10258 92.12% 85.23% 68.49% 5.23417 88.78% 75.96% 41.39% Analysis of Variance Normal Plot of the Standardized Effects (response is y1, a = 0.05 Adj F- P. Source DF Adj SS MS Value Value Model 7 1574.77 224.967 13.37 0.001 Linear 3 1446.79 482.263 28.65 0.000 A 1 393.48 393.477 23.38 0.001 E 784.91 784.912 46.63 0.000 Percent 1 268.40 268.401 15.95 0.004 2-Way 3 127.75 42.584 2.53 0.131 Interactions A*E 1.55 1.548 0.09 0.769 A*H 0.87 0.872 0.05 0.826 E*H 125.33 125.330 7.45 0.026 3-Way 0.23 0.228 0.01 0.910 Standardized Effect Interactions A*E*H 1 0.23 0.228 0.01 0.910 Error 8 134.65 16.831 Total 15 1709.42
Step by Step Solution
There are 3 Steps involved in it
Step: 1
Get Instant Access to Expert-Tailored Solutions
See step-by-step solutions with expert insights and AI powered tools for academic success
Step: 2
Step: 3
Ace Your Homework with AI
Get the answers you need in no time with our AI-driven, step-by-step assistance