Answered step by step
Verified Expert Solution
Question
1 Approved Answer
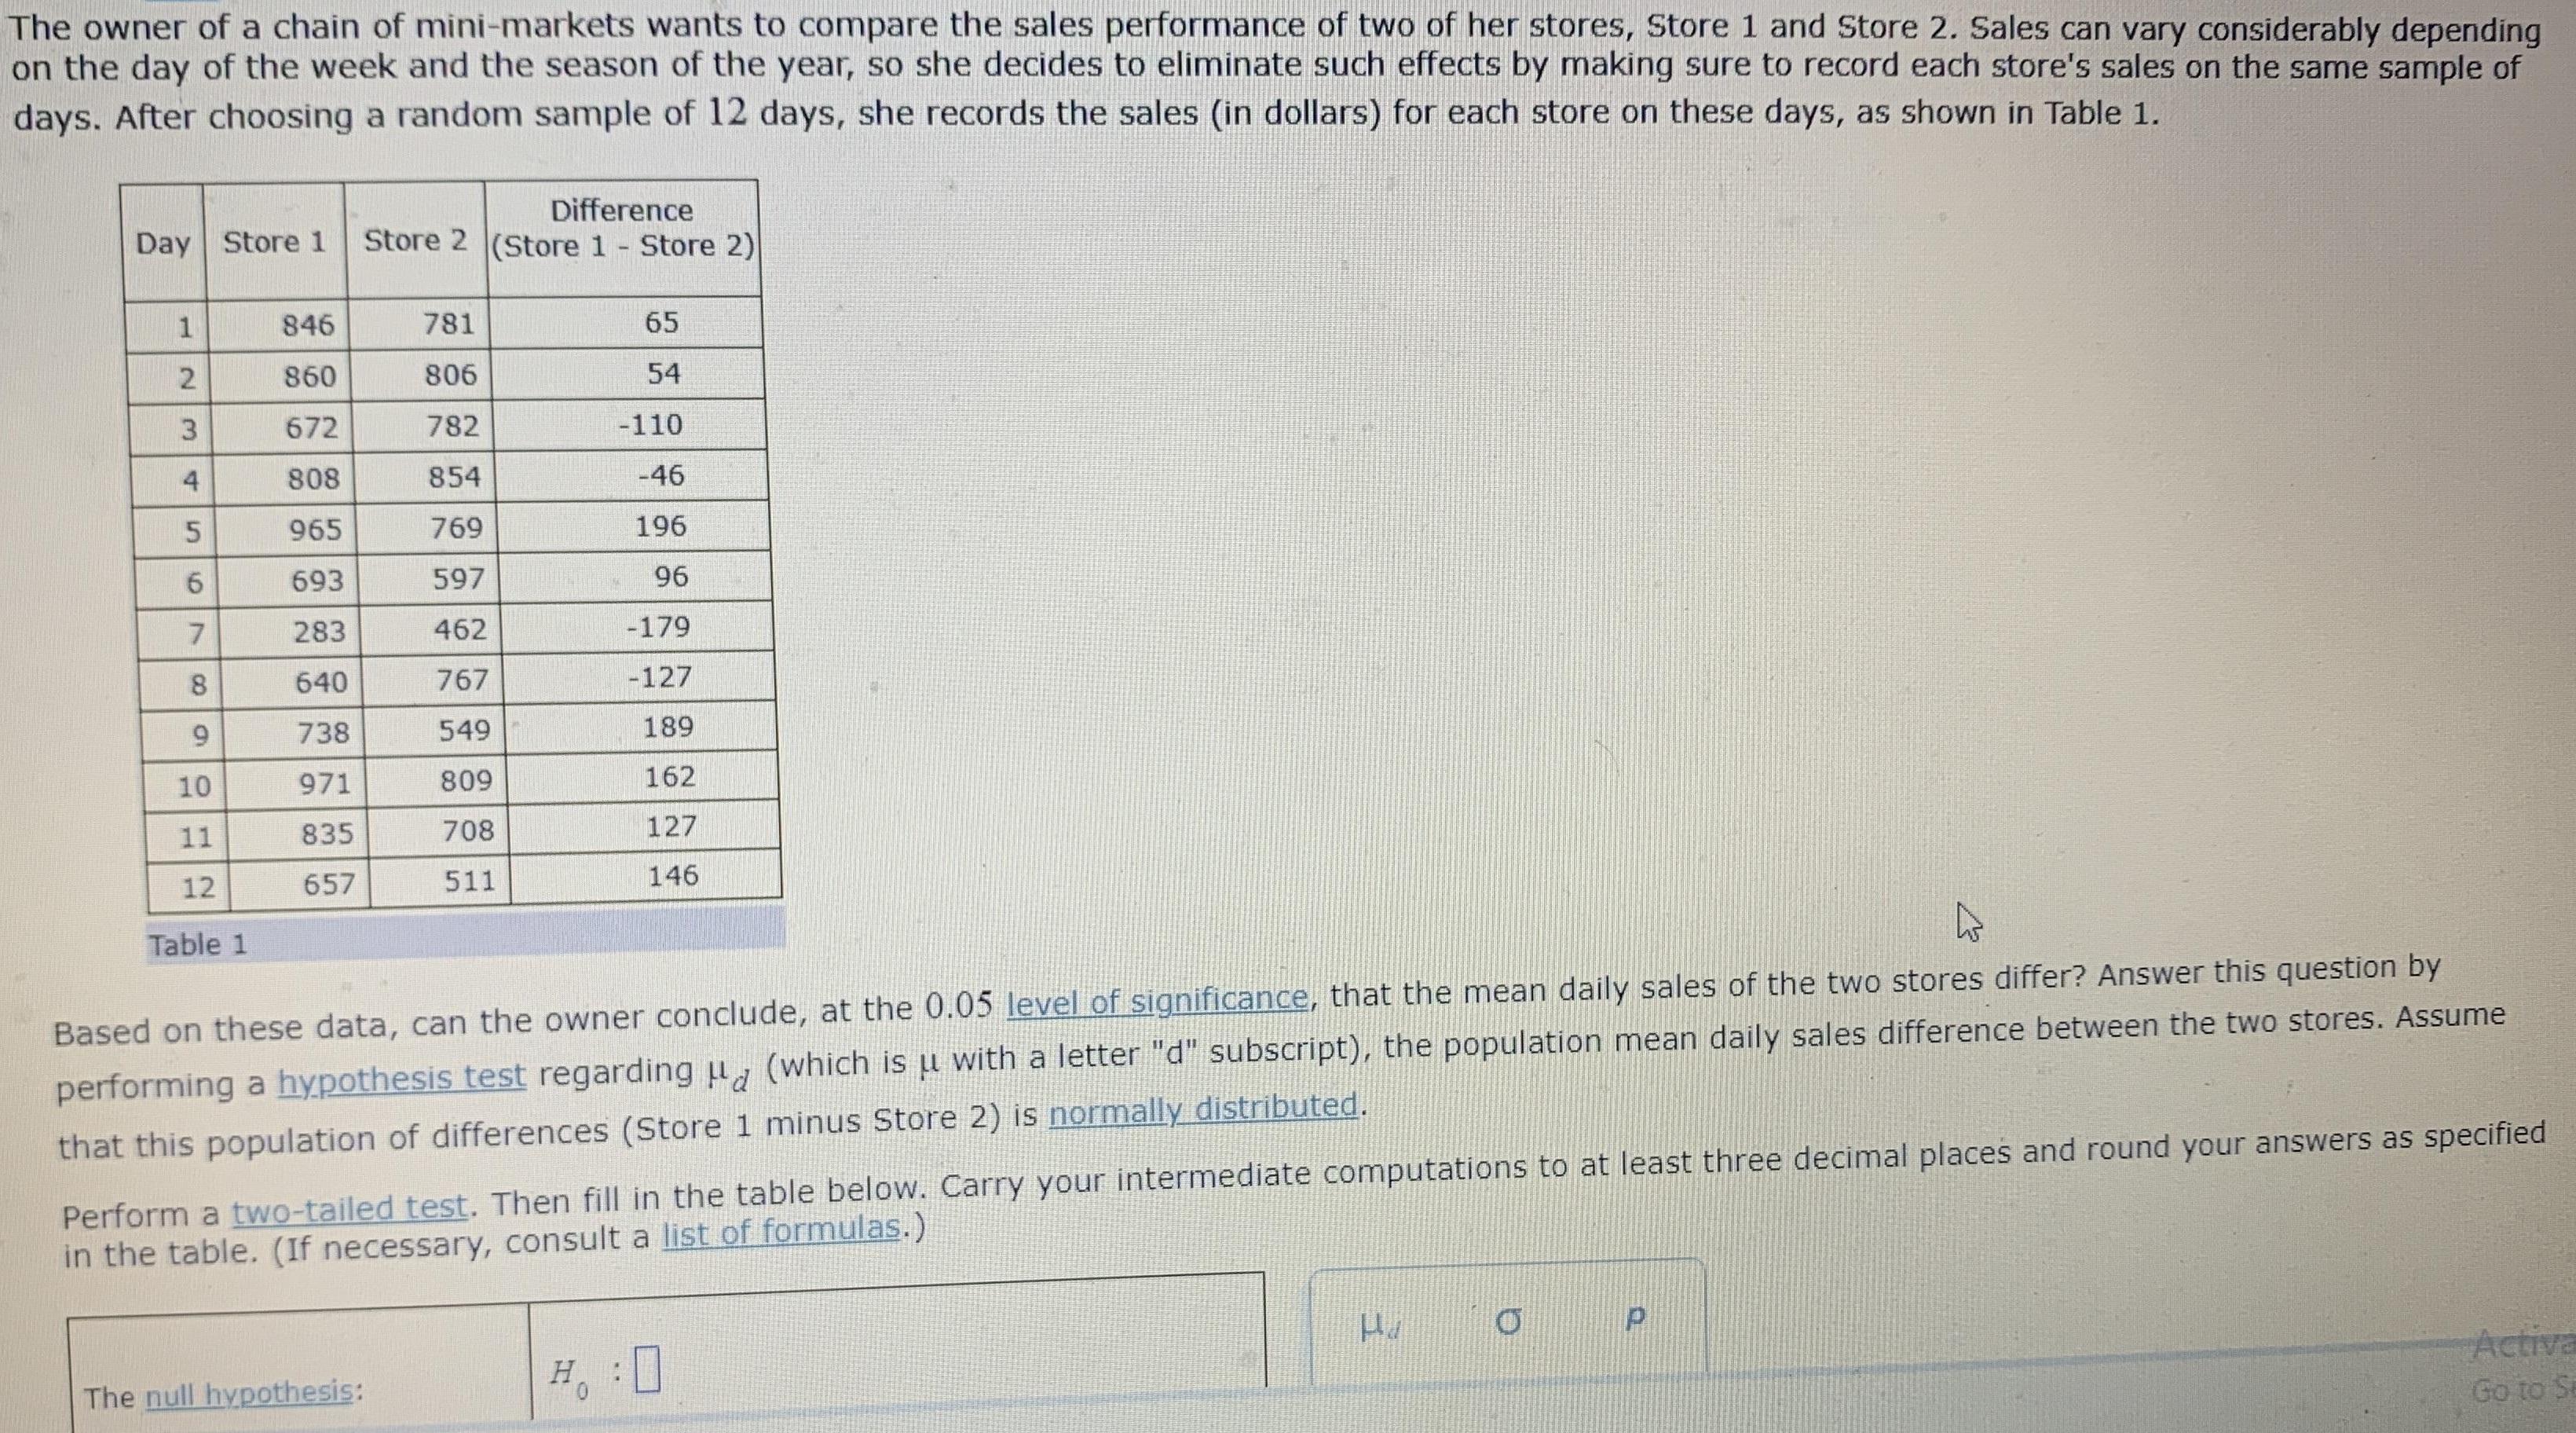
The owner of a chain of mini-markets wants to compare the sales performance of two of her stores, Store 1 and Store 2. Sales


The owner of a chain of mini-markets wants to compare the sales performance of two of her stores, Store 1 and Store 2. Sales can vary considerably depending on the day of the week and the season of the year, so she decides to eliminate such effects by making sure to record each store's sales on the same sample of days. After choosing a random sample of 12 days, she records the sales (in dollars) for each store on these days, as shown in Table 1. Difference Store 2 (Store 1 Store 2) Day Store 1 846 781 65 860 806 54 672 782 -110 808 854 -46 965 769 196 693 597 96 7. 283 462 -179 8. 640 767 -127 738 549 189 10 971 809 162 11 835 708 127 12 657 511 146 Table 1 Based on these data, can the owner conclude, at the 0.05 level of significance, that the mean daily sales of the two stores differ? Answer this question by performing a hypothesis test regarding u, (which is u with a letter "d" subscript), the population mean daily sales difference between the two stores. Assume Perform a two-tailed test. Then fill in the table below. Carry your intermediate computations to at least three decimal places and round your answers as specified in the table. (If necessary, consult a list of formulas.) that this population of differences (Store 1 minus Store 2) is normally distributed. Activa Go to St The null hypothesis: 2. 3. 4. 5. O CONFIDENCE INTERVALS AND HYPOTHESIS TESTING Emmanuel V Hypothesis test for the difference of population means: Paired... 657 511 146 Table 1 Based on these data, can the owner conclude, at the 0.05 level of significance, that the mean daily sales of the two stores differ? Answer this question by performing a hypothesis test regarding p (which is u with a letter "d" subscript), the population mean daily sales difference between the two stores. Assume that this population of differences (Store 1 minus Store 2) is normally distributed. Perform a two-tailed test. Then fill in the table below. Carry your intermediate computations to at least three decimal places and round your answers as specified in the table. (If necessary, consult a list of formulas.) The null hypothesis: H : 0 H. The alternative hypothesis: The type of test statistic: (Choose one)
Step by Step Solution
★★★★★
3.33 Rating (150 Votes )
There are 3 Steps involved in it
Step: 1

Get Instant Access to Expert-Tailored Solutions
See step-by-step solutions with expert insights and AI powered tools for academic success
Step: 2

Step: 3

Ace Your Homework with AI
Get the answers you need in no time with our AI-driven, step-by-step assistance
Get Started


