Answered step by step
Verified Expert Solution
Question
1 Approved Answer
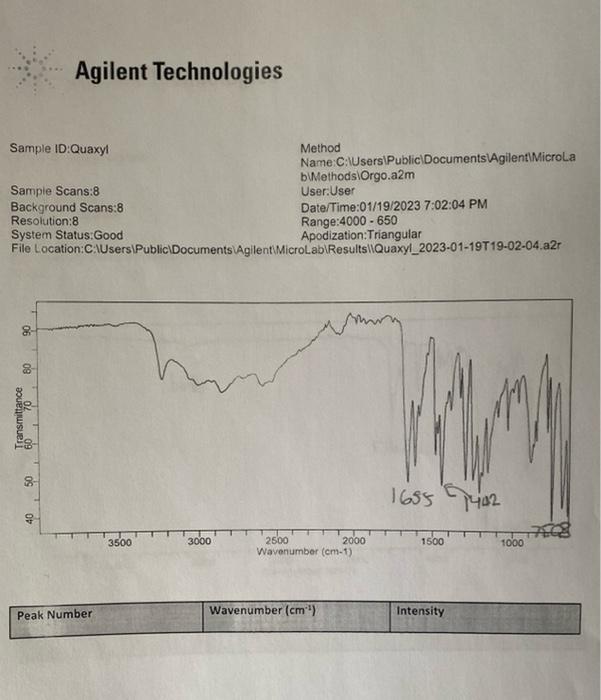
The peaks in the attached image is 1655, 1442, and 7508. 1. Draw the structures of the compounds that were recrystallized. 2. Develop a table
The peaks in the attached image is 1655, 1442, and 7508.
1. Draw the structures of the compounds that were recrystallized.
2. Develop a table that clearly shows the results of the experiment including % recovery, melting point, and % error. Follow ACS guidelines for the format of the table. the melting point is between 162C-164C.
3. Briefly summarize the experimental results.

Step by Step Solution
There are 3 Steps involved in it
Step: 1

Get Instant Access to Expert-Tailored Solutions
See step-by-step solutions with expert insights and AI powered tools for academic success
Step: 2

Step: 3

Ace Your Homework with AI
Get the answers you need in no time with our AI-driven, step-by-step assistance
Get Started


