

Question
The percentages of the people of a certain country who went to the movies at least once in the past year are shown in the

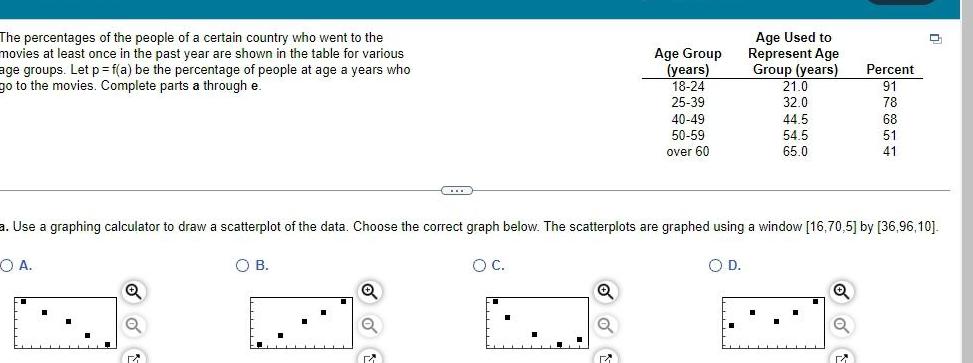
The percentages of the people of a certain country who went to the movies at least once in the past year are shown in the table for various age groups Let p f a be the percentage of people at age a years who go to the movies Complete parts a through e Q Q M O B O C Age Group years 18 24 25 39 Q 40 49 50 59 over 60 a Use a graphing calculator to draw a scatterplot of the data Choose the correct graph below The scatterplots are graphed using a window 16 70 5 by 36 96 10 O A O D Age Used to Represent Age Group years 21 0 32 0 44 5 54 5 65 0 Q Q Percent 91 78 M 68 51 41 O
Step by Step Solution
There are 3 Steps involved in it
Step: 1

Get Instant Access to Expert-Tailored Solutions
See step-by-step solutions with expert insights and AI powered tools for academic success
Step: 2

Step: 3
Ace Your Homework with AI
Get the answers you need in no time with our AI-driven, step-by-step assistance
Get Started
Discrete Mathematics Elementary And Beyond
Authors: L Lovasz, J Pelikan, K L Vesztergombi
1st Edition
6610010021, 9786610010028