Answered step by step
Verified Expert Solution
Question
1 Approved Answer
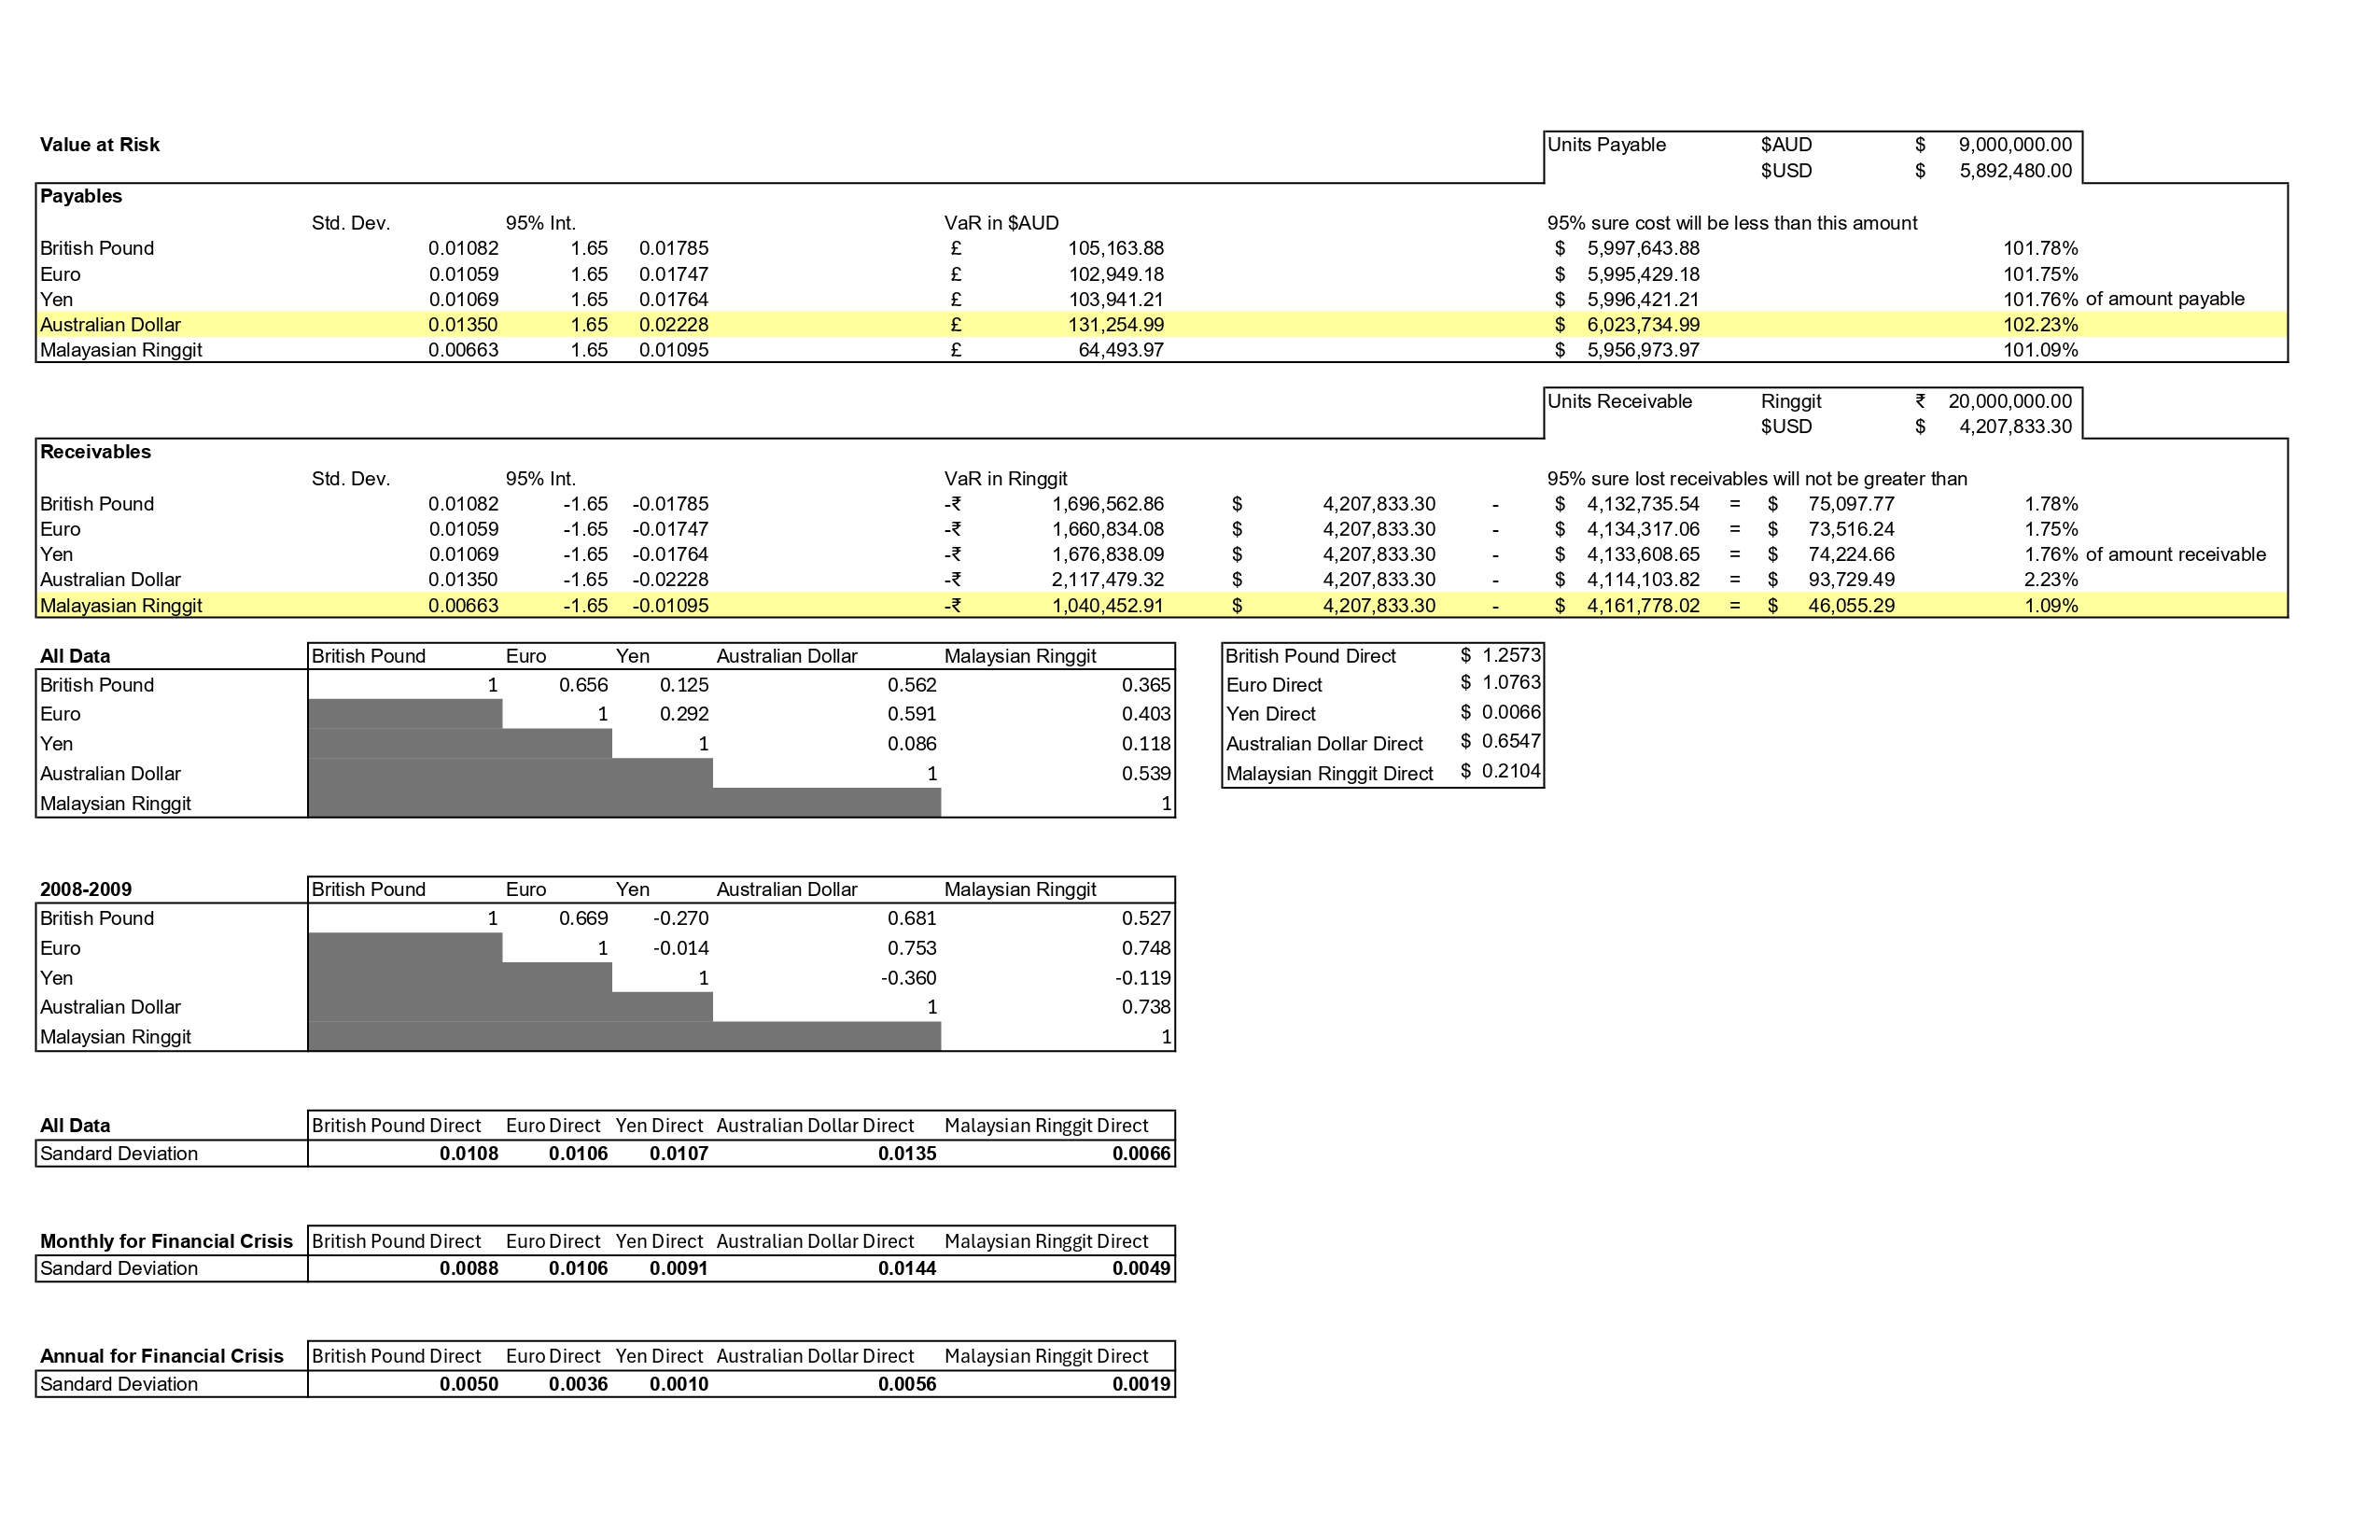
The photo above shows the VaR calculation, and Correlation and standard deviation data between years 2 0 0 0 to 2 0 2 4 of
The photo above shows the VaR calculation, and Correlation and standard deviation data between years to of the Euro, USD, Yen, Australian Dollar, and Malaysian Ringgit.
QUESTIONS:
Q: Which currencies were more or less volatile during this time period, and why?
Q: What happened to the volatilities of these currenies during the global financial crisis and why? What patterns can we observe in the data?

Step by Step Solution
There are 3 Steps involved in it
Step: 1

Get Instant Access to Expert-Tailored Solutions
See step-by-step solutions with expert insights and AI powered tools for academic success
Step: 2

Step: 3

Ace Your Homework with AI
Get the answers you need in no time with our AI-driven, step-by-step assistance
Get Started


