

Answered step by step
Verified Expert Solution
Question
1 Approved Answer
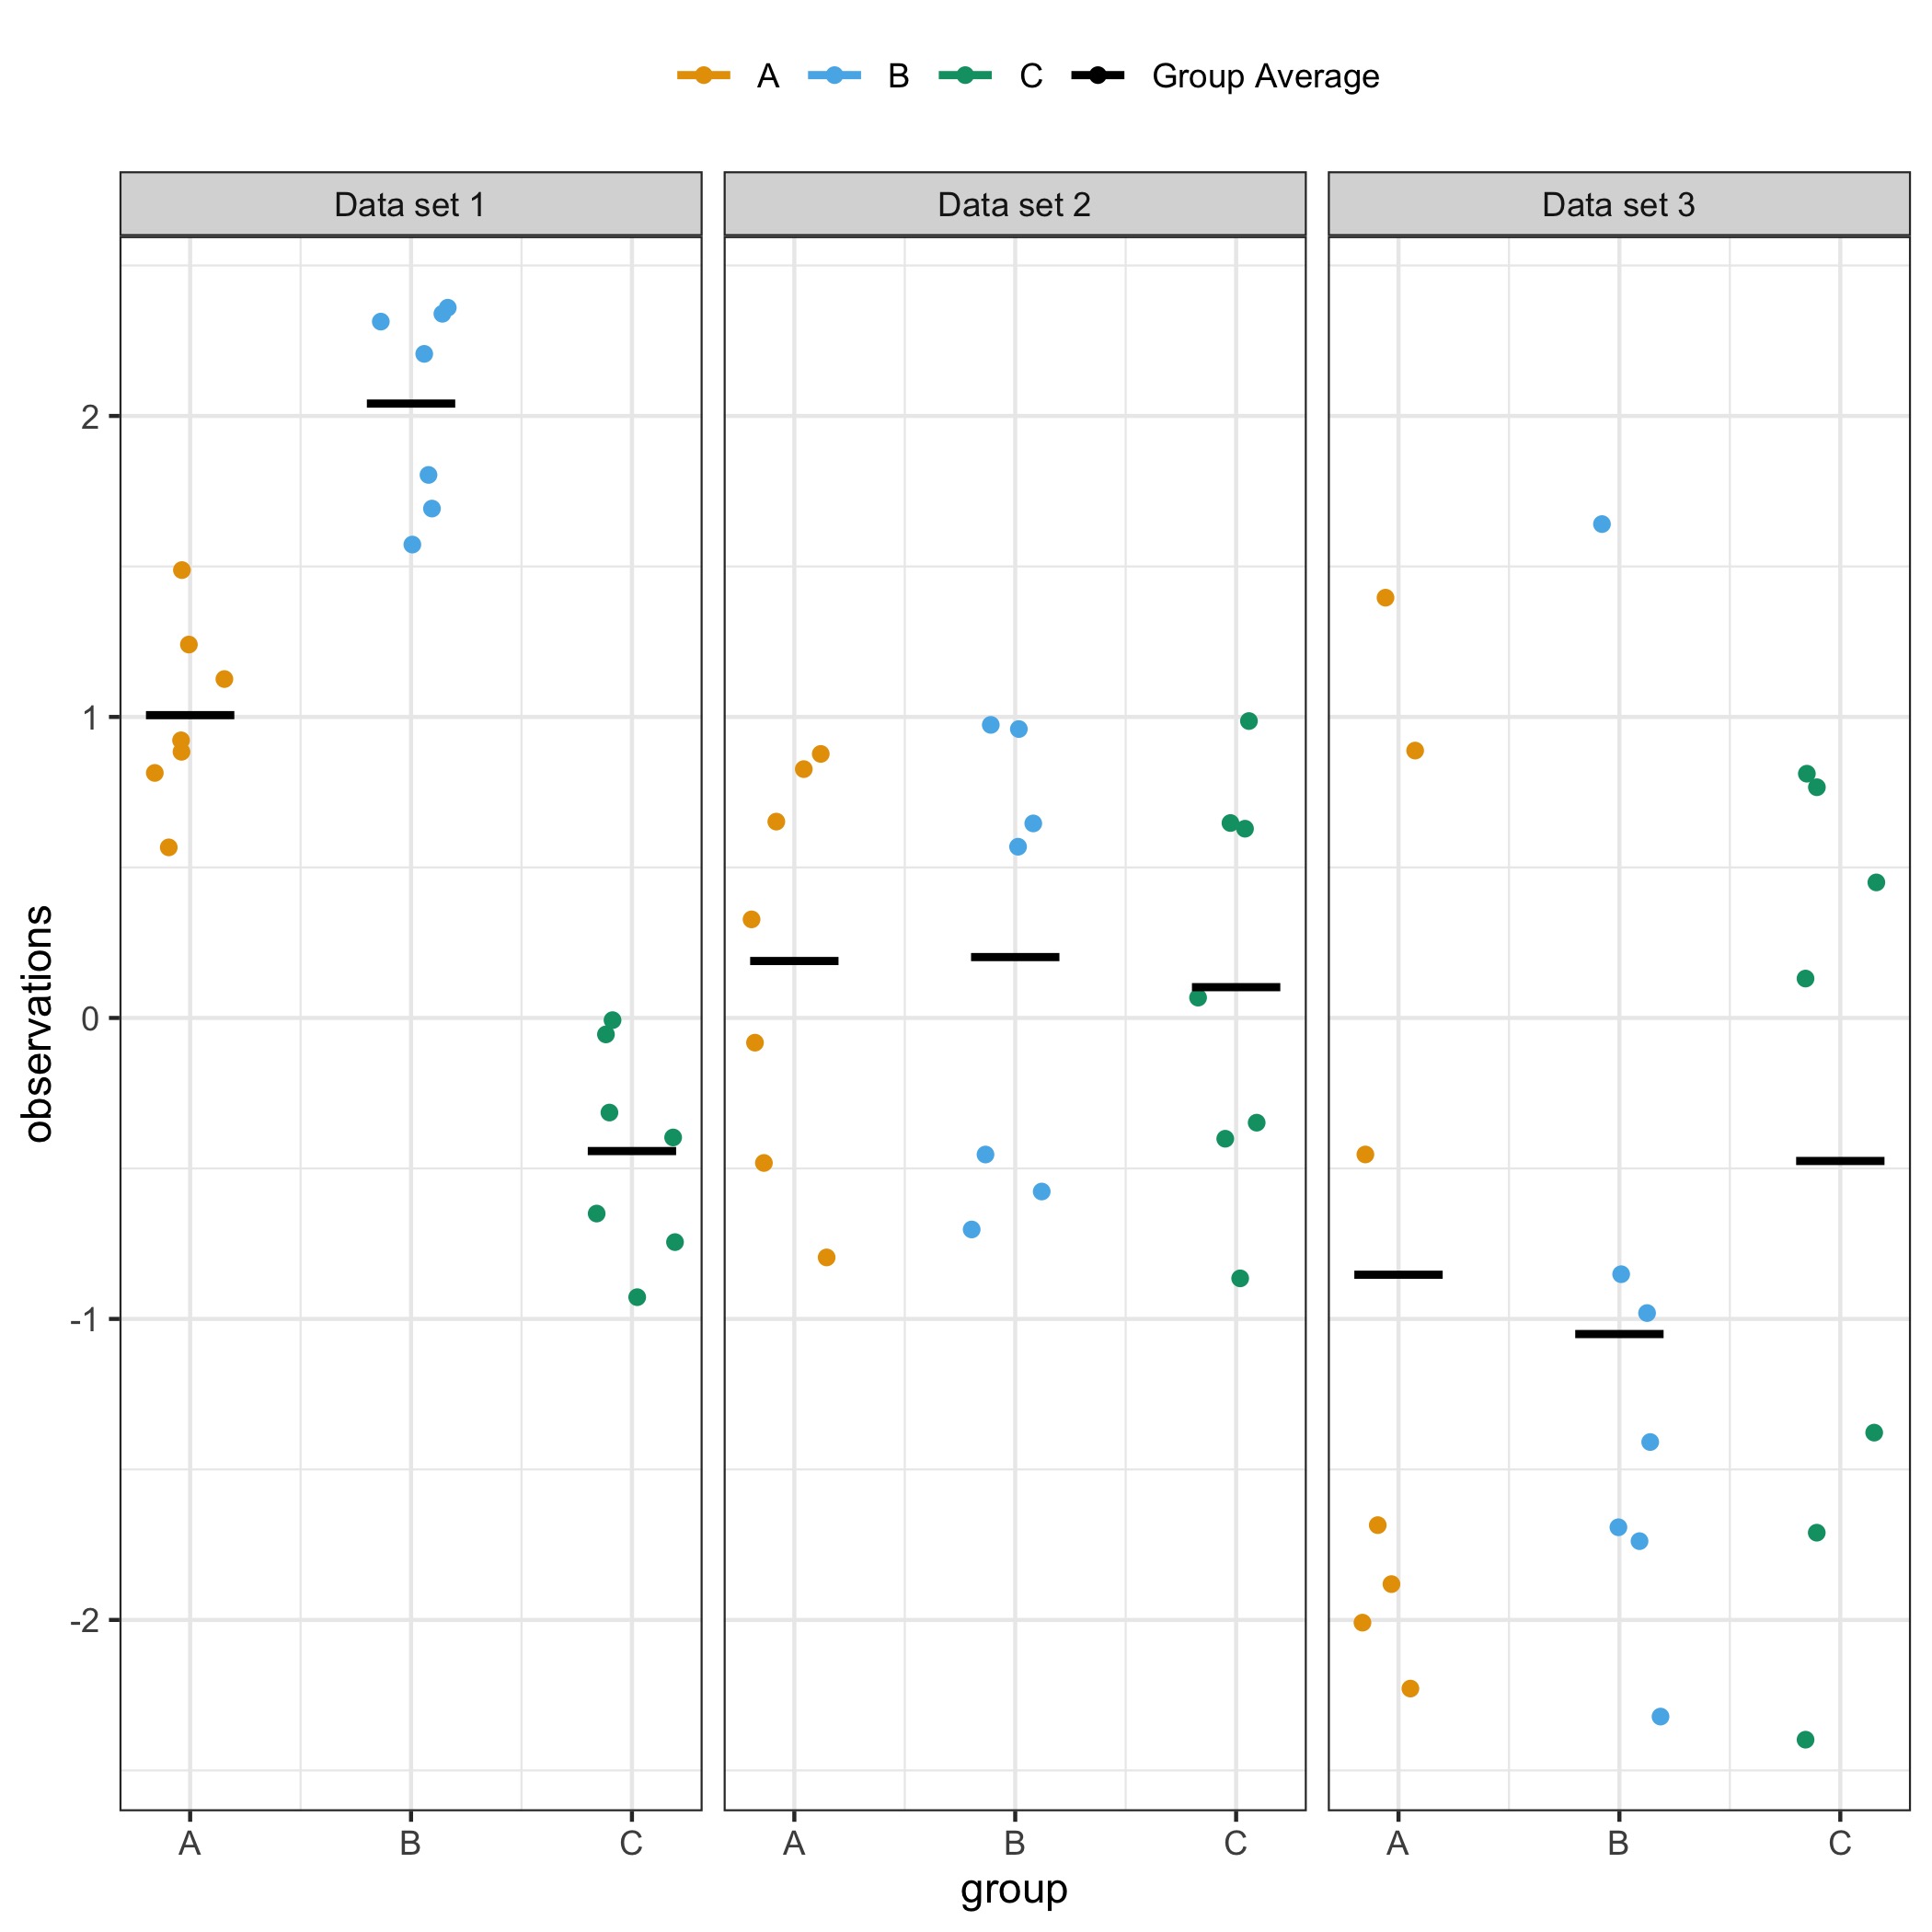
The plots below show the outcomes from three different experiments aiming at testing if there's a difference in mean outcomes between groups A, B, and
The plots below show the outcomes from three different experiments aiming at testing if there's a difference in mean outcomes between groups A, B, and C. Group means are indicated by the horizontal lines.
Step by Step Solution
There are 3 Steps involved in it
Step: 1

Get Instant Access to Expert-Tailored Solutions
See step-by-step solutions with expert insights and AI powered tools for academic success
Step: 2

Step: 3
Ace Your Homework with AI
Get the answers you need in no time with our AI-driven, step-by-step assistance
Get Started
Introduction To Probability Models
Authors: Sheldon M Ross
5th Edition
1483276589, 9781483276588