

Question
the population of Minnesota 2015 from https://www.census.gov 1. Double click any of the right digits in column C to discover the built-in function that was
the population of Minnesota 2015 from https://www.census.gov
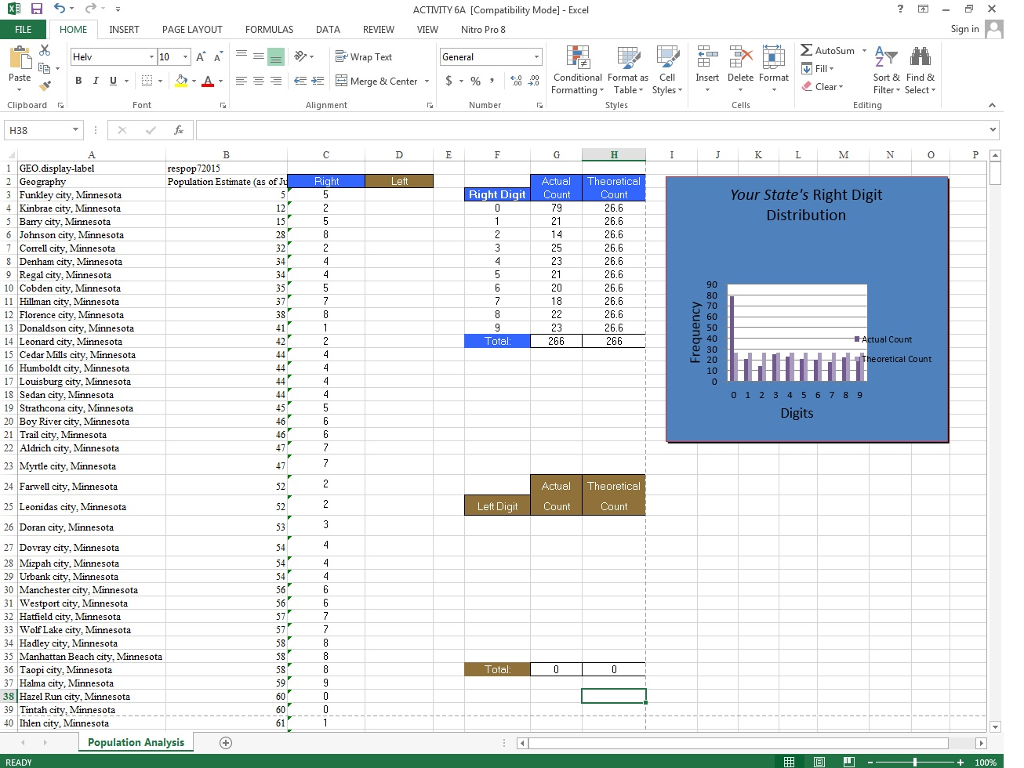
1. Double click any of the right digits in column C to discover the built-in function that was used to correctly copy the right-hand digits of the population. Double click the Actual Count cells from column G to see how the 'countif' function is used. You might investigate more information about this 'countif' function in your software's help documentation. As you investigate the "Theoretical Count" cells from column H, notice that the total number of towns and cities is being multiplied by 1/10 since there are 10 potential digits on the right side. On average, each digit should appear equally often.
2. Using the knowledge gained from the right-hand distribution data, table, and side-by-side bar graph, construct the same information and graph for the left digits in a parallel way. Be careful to note that the left digits are 1 through 9 and therefore the theoretical count requires that the total number of towns and cities be multiplied by 1/9. 10.
3. Depending on your graphing experience, it may be easier to copy and paste the bar graph and then customize it, rather than creating one from scratch for the left-hand digits. Refer to software help for some plotting tips to make an effective side-by-side bar graph of your data based on the left-hand digits of the populations.
4 Why do you suppose the actual count distributions are not as smooth as the theoretical?
5. By changing the right-hand theoretical count to reflect the logarithmic formula from Benford's Law, discuss how the shape improved the fit of the actual count . 3. Why would the right-hand digit's distribution be approximately uniform (flat)?
6. Why would the left-hand digit's distribution be roughly right-skewed? (see #5 below)
7. To better understand why there is a built-in bias for the lower digits in the left-hand distribution, scan the sorted populations of your state from low to high. Discuss why a city, as it grows in population, would remain with a left-hand digit of a 1 longer than a 2, or why longer with a 2 than a 3, etc. You may come to a better appreciation for the first digit phenomenon that occurs in certain kinds of data by noting how there is a 100% increase from 1 to 2 but then a dramatically tapering percentage thereafter. Fill in the rest of the table and discuss how this might apply to population changes in a town or city. Digit 1 2 3 4 5 6 7 8 9 %Increase n/a 100%
8. Based on your Internet research, discuss a practical application of Benford's Law that interested you and why. Also, include what the Benford ratios are for digits 1 through 9.
ACTIVITY 6A [Compatibility Model - Excel HOME INSERT PAGE LAYOUT FORMULAS DATA REVIEW VIEW Nitro Pro 8 "Wrap Text General B 1 u . .. Merge & Center. $, % , Conditional Format as Cell Insert Delete Format Sort &Find & Filter Select Clear ormatting Table Styl Alignment Number Styles Editing respop72015 Population Estimate (as of J ActualTheoretical Your State's Right Digit Distribution Right Diqit Count Count 26.6 26.6 ual Count eoretical Count 012 34567 89 Digits Actual Theoretical Left Digit Count Count Population Analysis READY ! + 100% 0 AZ AJUan bad 52582445 7 8 1 2 4 4 4 4 5 6677 2 2 3 444667-7 8 8 8 9 00| 5 2 1 2 2 3 3 3 3 3 1 2 4 4 4 4 5 6 47 47 2 2 3 4 5 4 5 6 7 5 5 S 5 5 60 -] ont 1 23456789 10 1 2 3 4 5 6 7 1 9 20 21 23 24 25 26 27 28 2 3 3 3 3 3 3 3 3 38 ACTIVITY 6A [Compatibility Model - Excel HOME INSERT PAGE LAYOUT FORMULAS DATA REVIEW VIEW Nitro Pro 8 "Wrap Text General B 1 u . .. Merge & Center. $, % , Conditional Format as Cell Insert Delete Format Sort &Find & Filter Select Clear ormatting Table Styl Alignment Number Styles Editing respop72015 Population Estimate (as of J ActualTheoretical Your State's Right Digit Distribution Right Diqit Count Count 26.6 26.6 ual Count eoretical Count 012 34567 89 Digits Actual Theoretical Left Digit Count Count Population Analysis READY ! + 100% 0 AZ AJUan bad 52582445 7 8 1 2 4 4 4 4 5 6677 2 2 3 444667-7 8 8 8 9 00| 5 2 1 2 2 3 3 3 3 3 1 2 4 4 4 4 5 6 47 47 2 2 3 4 5 4 5 6 7 5 5 S 5 5 60 -] ont 1 23456789 10 1 2 3 4 5 6 7 1 9 20 21 23 24 25 26 27 28 2 3 3 3 3 3 3 3 3 38Step by Step Solution
There are 3 Steps involved in it
Step: 1

Get Instant Access to Expert-Tailored Solutions
See step-by-step solutions with expert insights and AI powered tools for academic success
Step: 2

Step: 3
Ace Your Homework with AI
Get the answers you need in no time with our AI-driven, step-by-step assistance
Get Started
ISE Financial Institutions Management A Risk Management Approach
Authors: Anthony Saunders Professor, Marcia Millon Cornett, Otgo Erhemjamts
10th International Edition
1260571475, 9781260571479