

Question
The potential of solar panels on roofs built above national highways as a source of solar energy was investigated in the International Journal of Energy
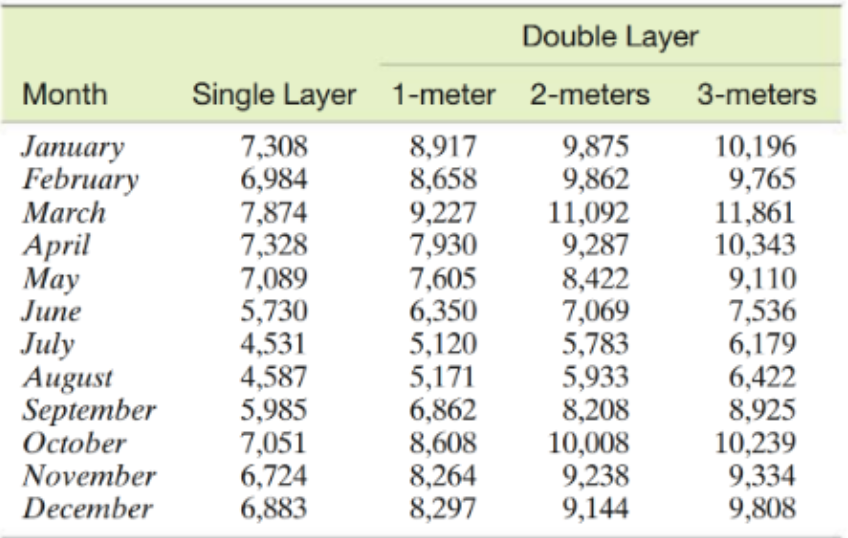
The potential of solar panels on roofs built above national highways as a source of solar energy was investigated in the International Journal of Energy and Environmental Engineering (December, 2013). Computer simulation was used to estimate the monthly solar energy (kilowatt-hours) generated from solar panels installed across a 200-kilometer stretch of highway in India. Each month, the simulation was run under each of four conditions: single-layer solar panels, double-layer solar panels 1 meter apart, double-layer solar panels 2 meters apart, and double-layer solar panels 3 meters apart. The data for 12 months are shown in the table below.
Conduct a randomized block design ANOVA analysis using Months as the blocking variable to compare the mean solar energy values generated by the four panel configurations. a. Identify the dependent variable, treatments, and blocks for this experiment.
b. Explain why a randomized block ANOVA is appropriate to apply (i.e. what is the purpose of blocking in this experiment)
c. State the hypotheses for the test to compare the mean solar energy values generated by the four panel configurations. Find the F-value and associated p-value and make a conclusion about the hypotheses at the 95% confidence level .
d. Use Tukey multiple comparison analysis of the four treatment means. Which pairs of means are significantly different? Can you provide a full ranking of the four configurations?
e. Does the data provide sufficient evidence to indicate that blocking was effective in reducing the experimental error at the 95% confidence level?
\begin{tabular}{lcccc} \hline & & \multicolumn{3}{c}{ Double Layer } \\ \cline { 3 - 5 } Month & Single Layer & 1-meter & 2-meters & 3-meters \\ \hline January & 7,308 & 8,917 & 9,875 & 10,196 \\ February & 6,984 & 8,658 & 9,862 & 9,765 \\ March & 7,874 & 9,227 & 11,092 & 11,861 \\ April & 7,328 & 7,930 & 9,287 & 10,343 \\ May & 7,089 & 7,605 & 8,422 & 9,110 \\ June & 5,730 & 6,350 & 7,069 & 7,536 \\ July & 4,531 & 5,120 & 5,783 & 6,179 \\ August & 4,587 & 5,171 & 5,933 & 6,422 \\ September & 5,985 & 6,862 & 8,208 & 8,925 \\ October & 7,051 & 8,608 & 10,008 & 10,239 \\ November & 6,724 & 8,264 & 9,238 & 9,334 \\ December & 6,883 & 8,297 & 9,144 & 9,808 \end{tabular} \begin{tabular}{lcccc} \hline & & \multicolumn{3}{c}{ Double Layer } \\ \cline { 3 - 5 } Month & Single Layer & 1-meter & 2-meters & 3-meters \\ \hline January & 7,308 & 8,917 & 9,875 & 10,196 \\ February & 6,984 & 8,658 & 9,862 & 9,765 \\ March & 7,874 & 9,227 & 11,092 & 11,861 \\ April & 7,328 & 7,930 & 9,287 & 10,343 \\ May & 7,089 & 7,605 & 8,422 & 9,110 \\ June & 5,730 & 6,350 & 7,069 & 7,536 \\ July & 4,531 & 5,120 & 5,783 & 6,179 \\ August & 4,587 & 5,171 & 5,933 & 6,422 \\ September & 5,985 & 6,862 & 8,208 & 8,925 \\ October & 7,051 & 8,608 & 10,008 & 10,239 \\ November & 6,724 & 8,264 & 9,238 & 9,334 \\ December & 6,883 & 8,297 & 9,144 & 9,808 \end{tabular}Step by Step Solution
There are 3 Steps involved in it
Step: 1

Get Instant Access to Expert-Tailored Solutions
See step-by-step solutions with expert insights and AI powered tools for academic success
Step: 2

Step: 3
Ace Your Homework with AI
Get the answers you need in no time with our AI-driven, step-by-step assistance
Get Started
The Smart Investors Survival Guide
Authors: Charles Carlson
1st Edition
0385503873, 978-0385503877