Question
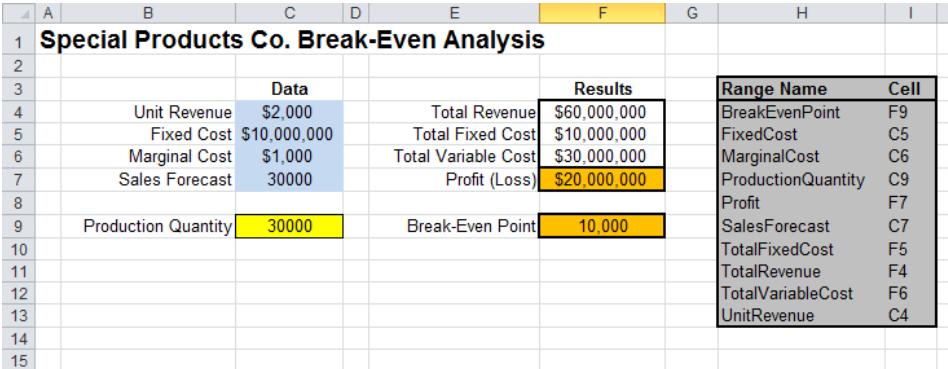
The production manager has decided to order a production run of Q=35000. Use simulation to find the distribution of profit given the following random inputs:
The production manager has decided to order a production run of Q=35000. Use simulation to find the distribution of profit given the following random inputs:
The fixed cost varies uniformly between 9 and 11 million dollars. The marginal cost is normally distributed with a mean of $1000 and a standard deviation of $200. The Sales Forecast is triangularly distributed with a minimum of 20000, a most likely value of 30,000 and an upper limit of 40000. All variables are continuous. Don't round to integer values.
Use 1000 iterations and find the mean and the 90th percentile of the profit distribution and the probability of a loss. Include the histogram of Profit in your response.

A B D E 1 Special Products Co. Break-Even Analysis 2 3 Data $2,000 Unit Revenue Fixed Cost $10,000,000 $1,000 Marginal Cost Sales Forecast 30000 Production Quantity 30000 45 4 5 6 7 8 9 10 112345 11 12 13 F Results Total Revenue $60,000,000 $10,000,000 Total Fixed Cost Total Variable Cost $30,000,000 Profit (Loss) $20,000,000 Break-Even Point 10,000 14 15 G H Range Name BreakEvenPoint Cell F9 FixedCost C5 MarginalCost C6 ProductionQuantity C9 Profit F7 SalesForecast C7 TotalFixedCost F5 TotalRevenue F4 TotalVariableCost F6 UnitRevenue C4
Step by Step Solution
3.57 Rating (161 Votes )
There are 3 Steps involved in it
Step: 1
Unit Revenue Fixed Cost Marginal Cost Sales Forecast Break even point Production Quanti...
Get Instant Access to Expert-Tailored Solutions
See step-by-step solutions with expert insights and AI powered tools for academic success
Step: 2

Step: 3

Ace Your Homework with AI
Get the answers you need in no time with our AI-driven, step-by-step assistance
Get Started


