Answered step by step
Verified Expert Solution
Question
1 Approved Answer
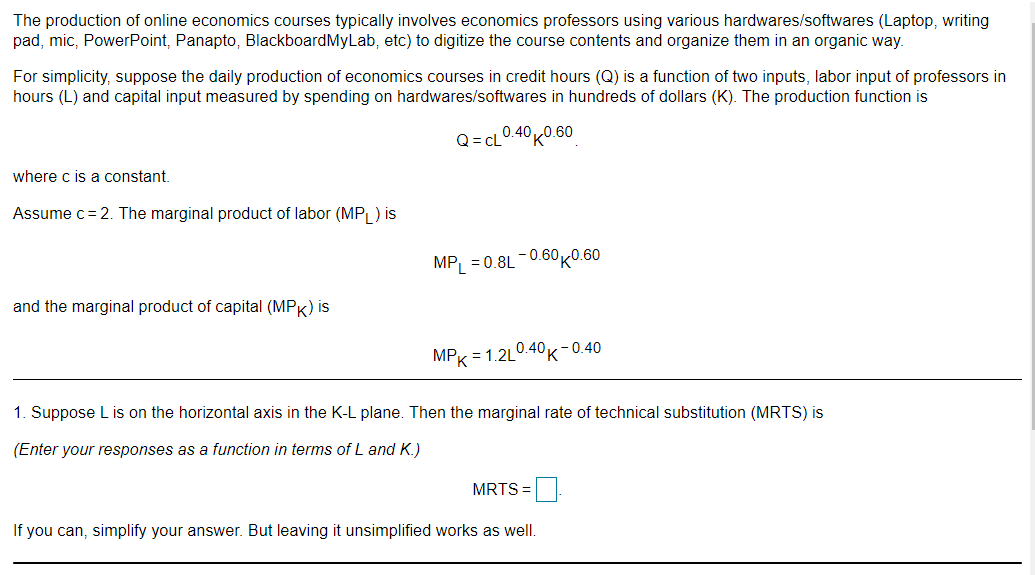
The production of online economics courses typically involves economics professors using various hardwares/softwares (Laptop, writing pad, mic, PowerPoint, Panapto, Blackboard MyLab, etc) to digitize


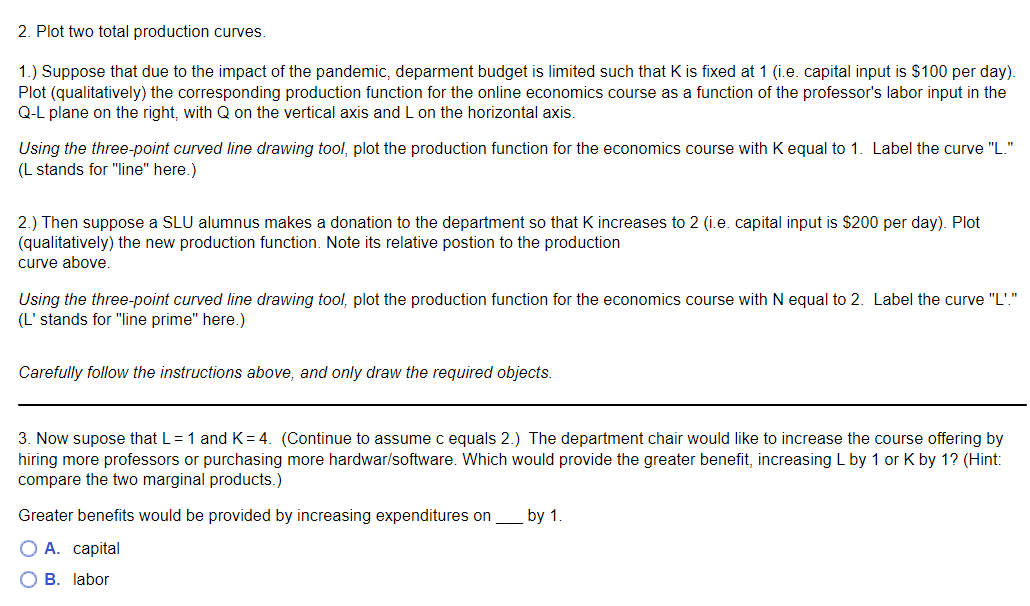
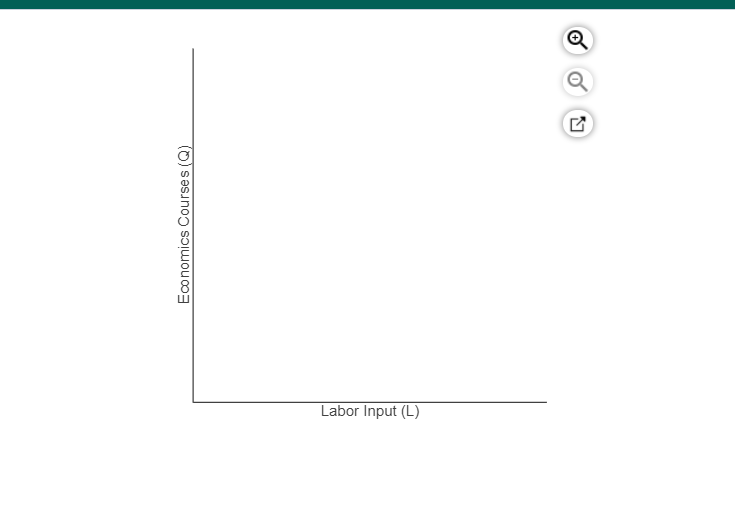
The production of online economics courses typically involves economics professors using various hardwares/softwares (Laptop, writing pad, mic, PowerPoint, Panapto, Blackboard MyLab, etc) to digitize the course contents and organize them in an organic way. For simplicity, suppose the daily production of economics courses in credit hours (Q) is a function of two inputs, labor input of professors in hours (L) and capital input measured by spending on hardwares/softwares in hundreds of dollars (K). The production function is 0.40 0.60 where c is a constant. Assume c = 2. The marginal product of labor (MPL) is and the marginal product of capital (MPK) is Q=CL MPL = 0.8L-0.600.60 MPK = 1.2L0.40K-0.40 1. Suppose L is on the horizontal axis in the K-L plane. Then the marginal rate of technical substitution (MRTS) is (Enter your responses as a function in terms of L and K.) MRTS = If you can, simplify your answer. But leaving it unsimplified works as well. 2. Plot two total production curves. 1.) Suppose that due to the impact of the pandemic, deparment budget is limited such that K is fixed at 1 (i.e. capital input is $100 per day). Plot (qualitatively) the corresponding production function for the online economics course as a function of the professor's labor input in the Q-L plane on the right, with Q on the vertical axis and L on the horizontal axis. Using the three-point curved line drawing tool, plot the production function for the economics course with K equal to 1. Label the curve "L." (L stands for "line" here.) 2.) Then suppose a SLU alumnus makes a donation to the department so that K increases to 2 (i.e. capital input is $200 per day). Plot (qualitatively) the new production function. Note its relative postion to the production curve above. Using the three-point curved line drawing tool, plot the production function for the economics course with N equal to 2. Label the curve "L"." (L' stands for "line prime" here.) Carefully follow the instructions above, and only draw the required objects. 3. Now supose that L = 1 and K= 4. (Continue to assume c equals 2.) The department chair would like to increase the course offering by hiring more professors or purchasing more hardwar/software. Which would provide the greater benefit, increasing L by 1 or K by 1? (Hint: compare the two marginal products.) Greater benefits would be provided by increasing expenditures on by 1. A. capital O B. labor Economics Courses (Q) Labor Input (L) G
Step by Step Solution
★★★★★
3.38 Rating (173 Votes )
There are 3 Steps involved in it
Step: 1

Get Instant Access to Expert-Tailored Solutions
See step-by-step solutions with expert insights and AI powered tools for academic success
Step: 2

Step: 3

Ace Your Homework with AI
Get the answers you need in no time with our AI-driven, step-by-step assistance
Get Started


