Answered step by step
Verified Expert Solution
Question
1 Approved Answer
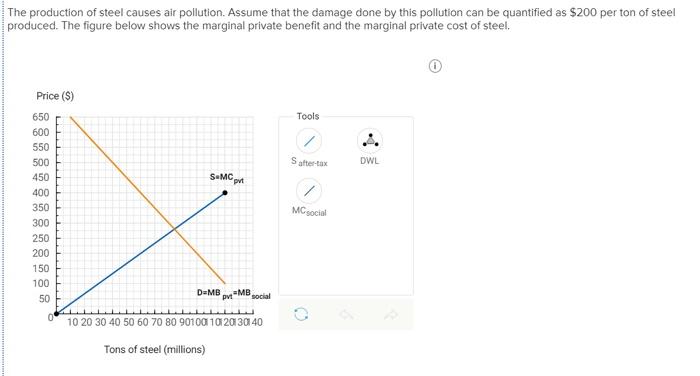
The production of steel causes air pollution. Assume that the damage done by this pollution can be quantified as $200 per ton of steel


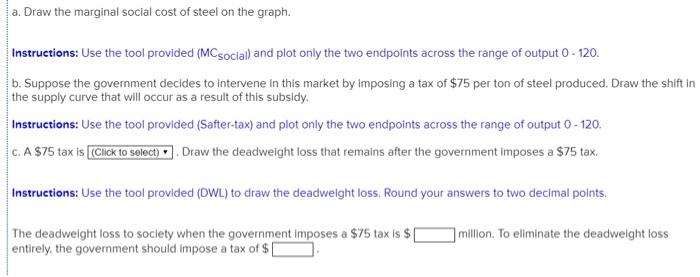
The production of steel causes air pollution. Assume that the damage done by this pollution can be quantified as $200 per ton of steel produced. The figure below shows the marginal private benefit and the marginal private cost of steel. Price (S) 650 Tools 600 550 500 Safter-tax DWL 450 S-MC t 400 350 MCgocial 300 250 200 150 100 D=MB pvt" MB, social 50 10 20 30 40 50 60 70 80 90100 102030 40 Tons of steel (millions) a. Draw the marginal social cost of steel on the graph. Instructions: Use the tool provided (MCsocial) and plot only the two endpoints across the range of output 0 - 120. b. Suppose the government decides to intervene in this market by imposing a tax of $75 per ton of steel produced. Draw the shift in the supply curve that will occur as a result of this subsidy. Instructions: Use the tool provided (Safter-tax) and plot only the two endpoints across the range of output 0- 120. C. A $75 tax is (Click to select) . Draw the deadweight loss that remains after the government imposes a $75 tax. Instructions: Use the tool provided (DWL) to draw the deadwelght loss. Round your answers to two decimal polnts. The deadweight loss to society when the government imposes a $75 tax is $ entirely, the government should impose a tax of $| million. To eliminate the deadweight loss
Step by Step Solution
★★★★★
3.44 Rating (147 Votes )
There are 3 Steps involved in it
Step: 1
a b S aftertax will shift MC curve leftward by 75 at every output level c Th...
Get Instant Access to Expert-Tailored Solutions
See step-by-step solutions with expert insights and AI powered tools for academic success
Step: 2

Step: 3

Ace Your Homework with AI
Get the answers you need in no time with our AI-driven, step-by-step assistance
Get Started


