Answered step by step
Verified Expert Solution
Question
1 Approved Answer
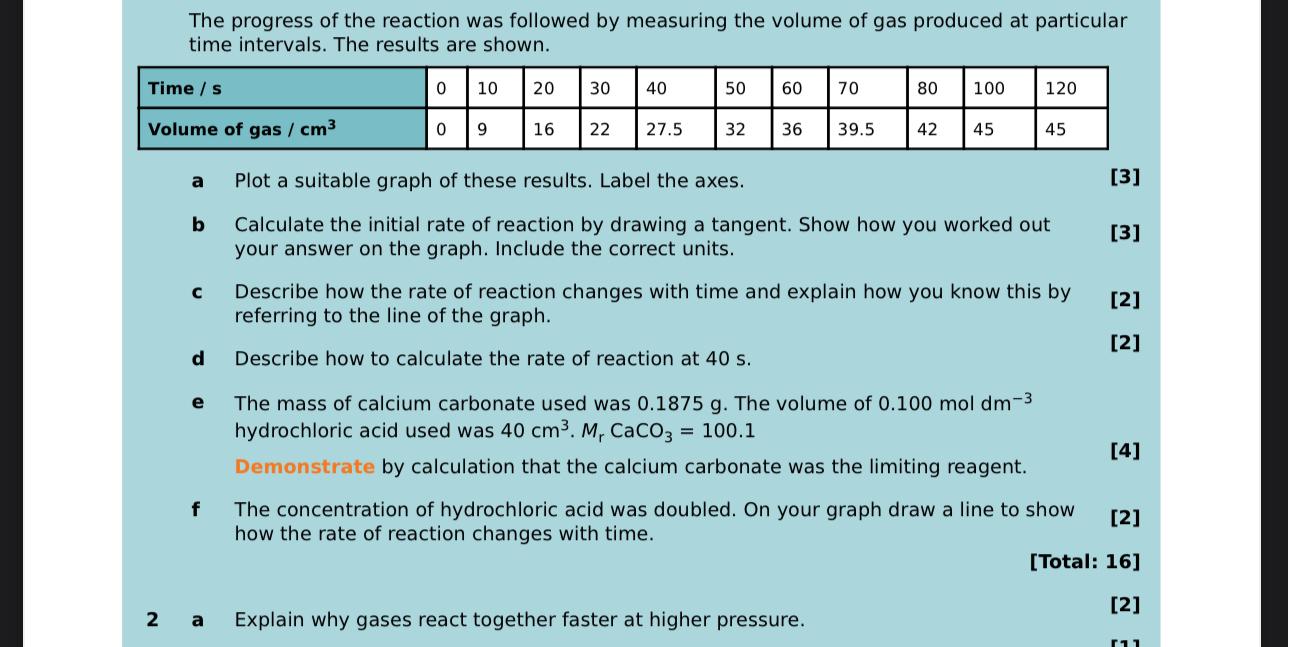
The progress of the reaction was followed by measuring the volume of gas produced at particular time intervals. The results are shown. table [
The progress of the reaction was followed by measuring the volume of gas produced at particular time intervals. The results are shown.
tableTime sVolume of gas
a Plot a suitable graph of these results. Label the axes.
b Calculate the initial rate of reaction by drawing a tangent. Show how you worked out
your answer on the graph. Include the correct units.
c Describe how the rate of reaction changes with time and explain how you know this by
referring to the line of the graph.
d Describe how to calculate the rate of reaction at
e The mass of calcium carbonate used was The volume of hydrochloric acid used was
Demonstrate by calculation that the calcium carbonate was the limiting reagent.
f The concentration of hydrochloric acid was doubled. On your graph draw a line to show how the rate of reaction changes with time.
Total:
a Explain why gases react together faster at higher pressure.

Step by Step Solution
There are 3 Steps involved in it
Step: 1

Get Instant Access to Expert-Tailored Solutions
See step-by-step solutions with expert insights and AI powered tools for academic success
Step: 2

Step: 3

Ace Your Homework with AI
Get the answers you need in no time with our AI-driven, step-by-step assistance
Get Started


