Answered step by step
Verified Expert Solution
Question
1 Approved Answer
The projected population of a region for selected years from 2000 to 2060 is shown in the table on the right, with the population

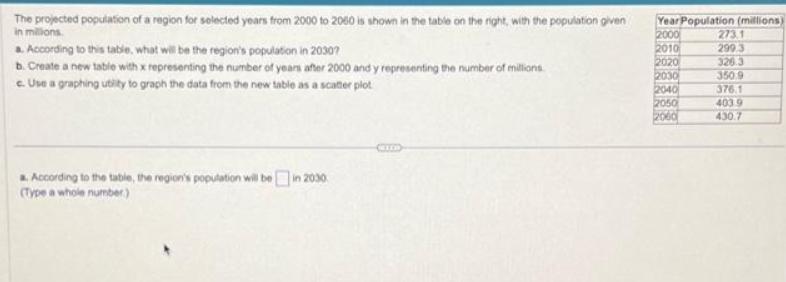
The projected population of a region for selected years from 2000 to 2060 is shown in the table on the right, with the population given in millions. a. According to this table, what will be the region's population in 2030? b. Create a new table with x representing the number of years after 2000 and y representing the number of millions c. Use a graphing utility to graph the data from the new table as a scatter plot a. According to the table, the region's population will be in 2030 (Type a whole number) CELE Year Population (millions) 2000 2010 2020 2030 2040 2050 2060 273.1 299.3 326.3 350.9 376.1 403.9 430.7
Step by Step Solution
★★★★★
3.40 Rating (156 Votes )
There are 3 Steps involved in it
Step: 1
A According to the table the regions population in 2030 will be 350...
Get Instant Access to Expert-Tailored Solutions
See step-by-step solutions with expert insights and AI powered tools for academic success
Step: 2

Step: 3

Ace Your Homework with AI
Get the answers you need in no time with our AI-driven, step-by-step assistance
Get Started


