

Question
The provided data set (the picture uploaded) will review claims and perform hypothesis testing to make a decision. You will then complete a write-up that
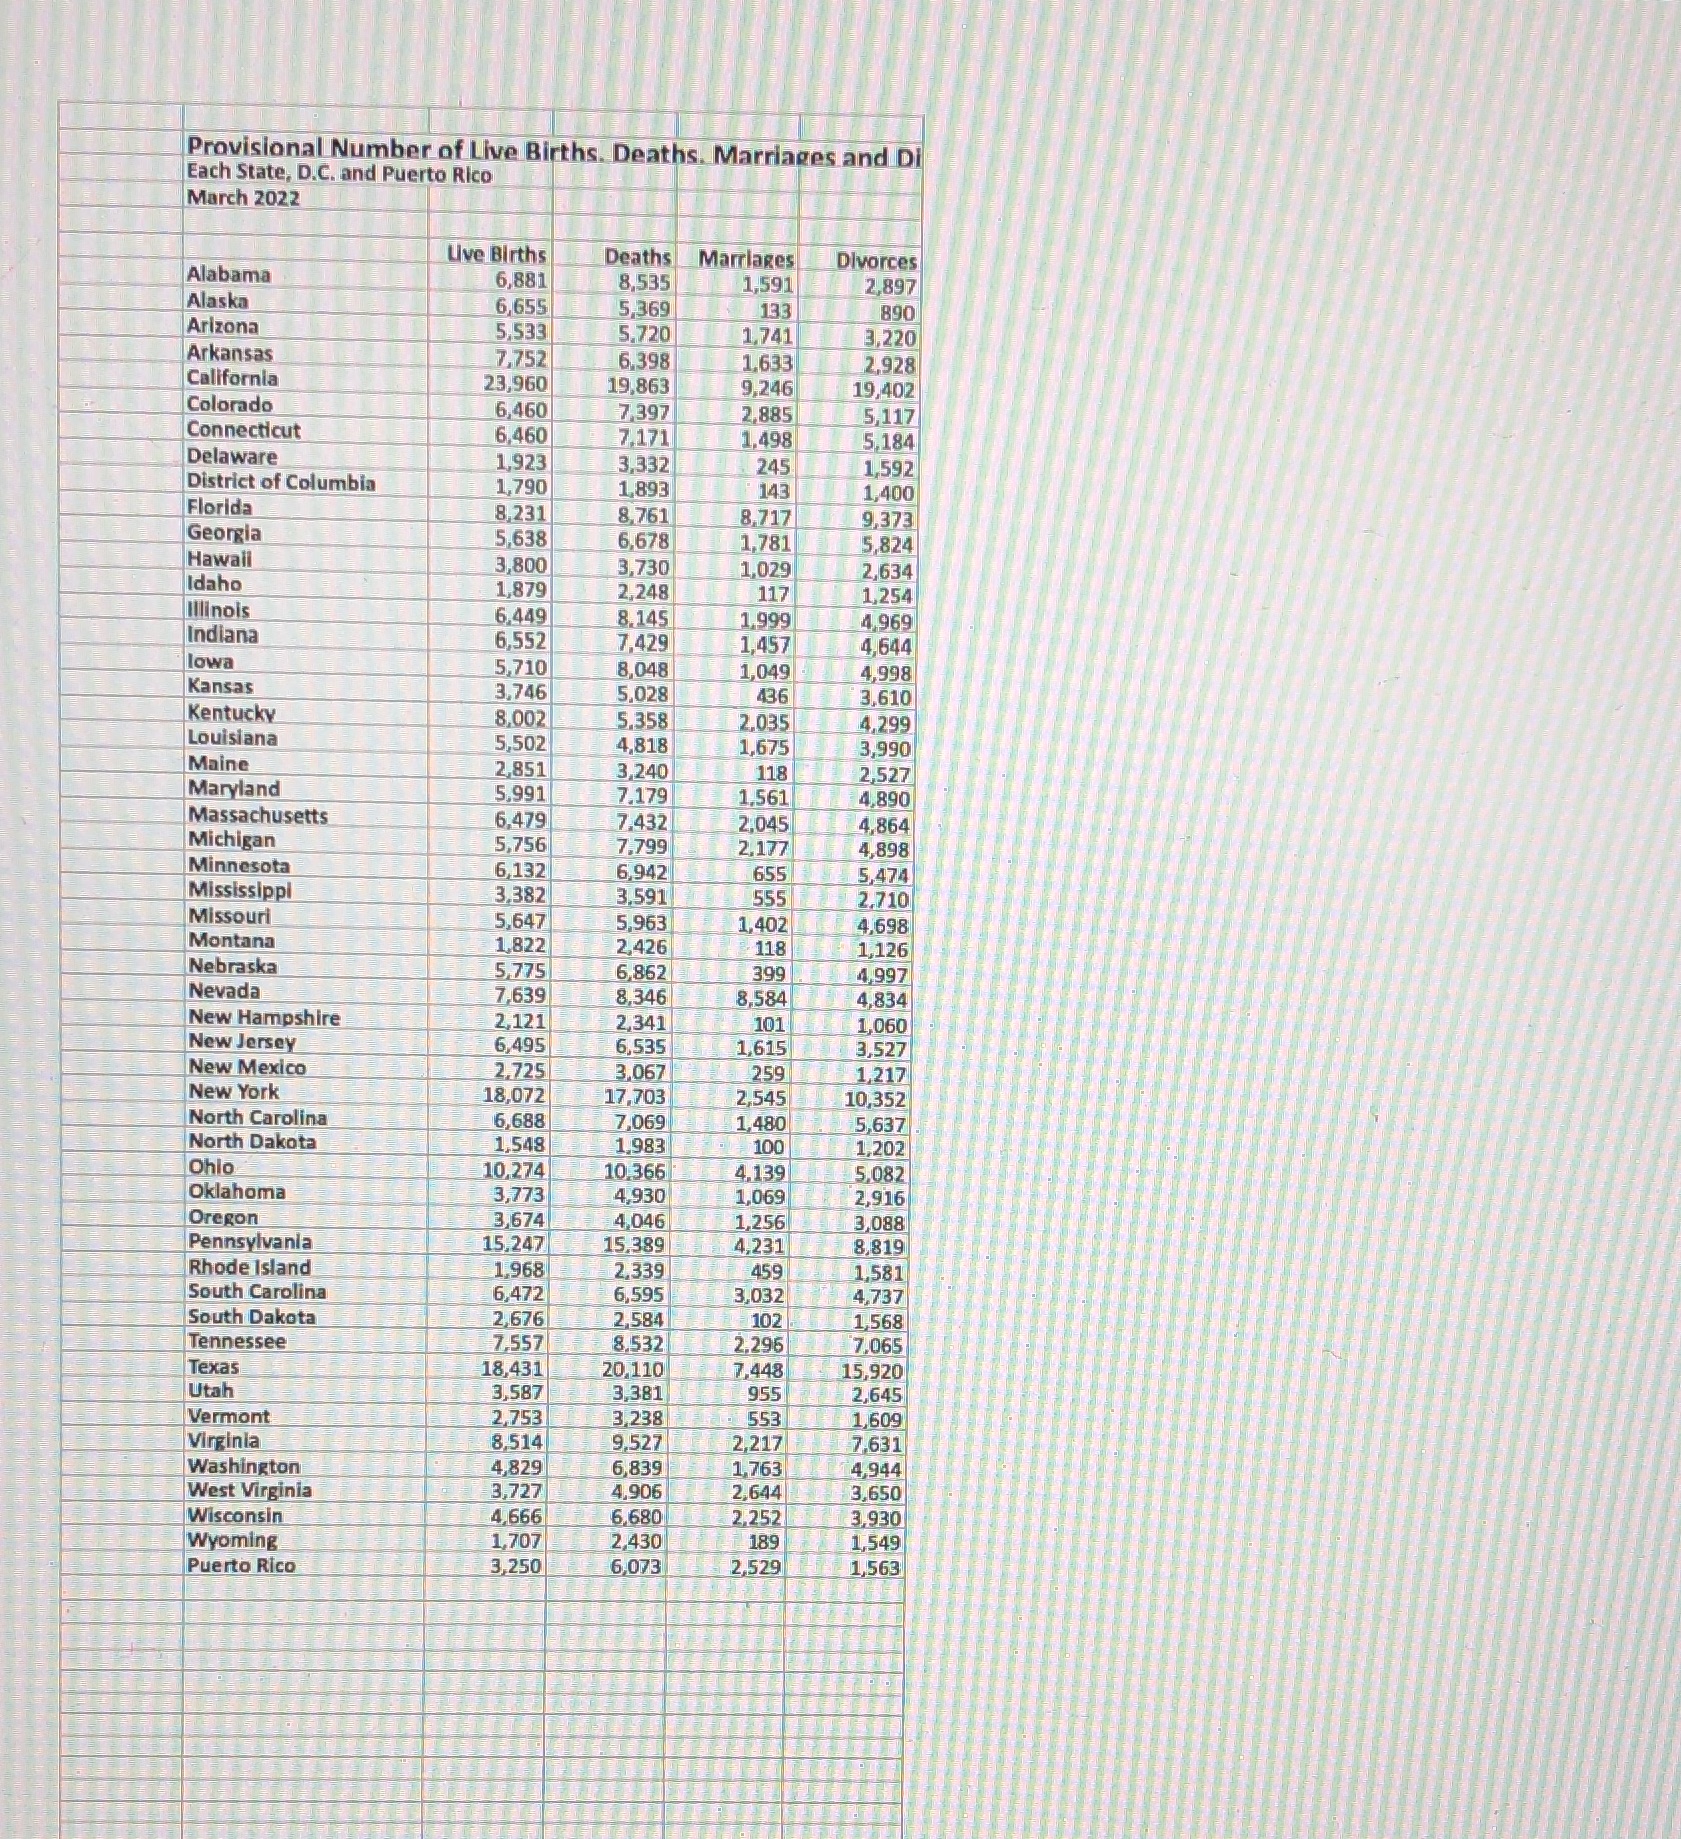
The provided data set (the picture uploaded) will review claims and perform hypothesis testing to make a decision. You will then complete a write-up that includes the calculations.
The government logs the number of documented births, deaths, marriages and divorces however it is possible to have undocumented cases. In part II of this project, you are going to test claims about total births, deaths, marriages and divorces.
Summary Table for: DEATHS
Mean:
Median:
Sample Standard Deviation:
Minimum: Maximum:
Sample Size:
Summary Table for: LIVE BIRTHS
Mean:
Median:
Sample Standard Deviation:
Minimum: Maximum:
Sample Size:
Summary Table for: DIVORCES
Mean:
Median:
Sample Standard Deviation:
Minimum:
Maximum:
Sample Size:
Summary Table for: MARRIAGES
Mean:
Median:
Sample Standard Deviation:
Minimum:
Maximum:
Sample Size:
Step by Step Solution
There are 3 Steps involved in it
Step: 1

Get Instant Access to Expert-Tailored Solutions
See step-by-step solutions with expert insights and AI powered tools for academic success
Step: 2

Step: 3
Ace Your Homework with AI
Get the answers you need in no time with our AI-driven, step-by-step assistance
Get Started
Calculus For Scientists And Engineers Early Transcendentals
Authors: William L Briggs, Bernard Gillett, Bill L Briggs, Lyle Cochran
1st Edition
0321849213, 9780321849212