

Question
The Public Works Department in Sunny Village, California, has a mechanical shop responsible for maintaining the citys vehicles. The shop director, Steven Douglas, has five
The Public Works Department in Sunny Village, California, has a mechanical shop responsible for maintaining the citys vehicles. The shop director, Steven Douglas, has five employees and a budget of $845,000 this year. In addition to the regular checkup and maintenance services, the shop also provides short classes for city employees on how to efficiently operate cars and trucks. The goal of the shop is to let no vehicles break down in service, but breakdowns do happen. When they happen, a diagnostic checkup is performed to find out the possible cause.
The current diagnostic system was purchased five years ago. It is a manual tester, called Vehicle Testing Monitor 2000 (or VTM 2000). It includes a communicator that connects a vehicle with a computer screen. A vehicle consists of several major systems (e.g., the engine system, the electric circuit system, the fuel system, and the steering system). Each system also has accessory parts. If one part breaks, the whole system fails to work. To find out the problem part, a mechanic needs to connect the VTM with the vehicle system. If a system consists of several parts, VTM has to check these parts one by one until the problem part is identified. Figure 6.1 shows a diagnostic process for a system that has three accessory parts.
Steven believes the VTM is slow in diagnosis and yields a high possibility of re- placing good parts. In this years budget request, Steven requested a new diagnostic system, Quality Test System (or QTS). QTS includes an information database, a test
instrument module, and an expert diagnostic software system. During a diagnosis, a mechanic first enters a vehicles identification code. After analyzing the meter read- outs and problem symptoms, the expert system identifies the problem part and then gives repair instructions, shown on a computer monitor. So, instead of a step-by-step diagnosis for each part at a time by VTM, QTS checks all parts of a system simulta- neously. Figure 6.2 shows how it works for a system that has three parts.
In a recent budget preparation meeting, Steven presented his case to his supervisor, Public Works Director Lisa Jones. He estimated that the price of QTS was $21,400. The estimated operating cost was $280 each year. The estimated life of the system was six years (including the current year).
He expected that the benefits of QTS would come from two sources. First, diag- noses would be quicker, so diagnostic time would be saved. Diagnostic time is the time from the beginning of a diagnosis to the discovery of a problem. The VTMs multiple-step diagnostic process would be replaced by a single-step process of QTS. Time saving for each diagnosis problem would differ. For instance, it takes VTM 45 to 60 minutes to test an infected flow, compared to 3 minutes by QTS. For most engine problems, VTM needs 60 to 120 minutes, compared to 10 minutes by QTS. Steven estimated that, on average for each diagnosis, VTM would take 150 minutes, while QTS would take about 30.
The city has ninety vehicles: thirty police cars and sixty trucks. All the vehicles are in relatively good shape. The police cars are replaced every two years. Only a small number of vehicles need diagnostic services. The mechanic shop in the department does fifty-two diagnoses a year (once a week for fifty-two weeks a year). Also, on average, a mechanics hourly wage and benefits are $12.
The second major benefit comes from an accurate diagnosis. QTS is more ac- curate than VTM in diagnosis. With VTM, mechanics are more likely to mistakenly replace a good part. This is called ineffective replacement. With the new system, the problem part could be identified accurately. The cost for ineffective replacement is $50 a diagnosis for VTM. This cost for QTS would be $0. Finally, Steven said, if we get QTS, we can sell VTM for about $692 in todays market. Lisa thought Stevens analysis was too broad and asked for a CBA.
First, there is no need to conduct a CBA for the existing system, VTM. The decision of purchasing the system was made and the cost associated with VTM is a sunk cost. To estimate the cost and benefit of QTS, we need to know the objective of the vehicle diagnostic system. The goal of the mechanic shop in the Public Works Department is stated as protection of the citys vehicles through efficient and effective maintenance and repair.
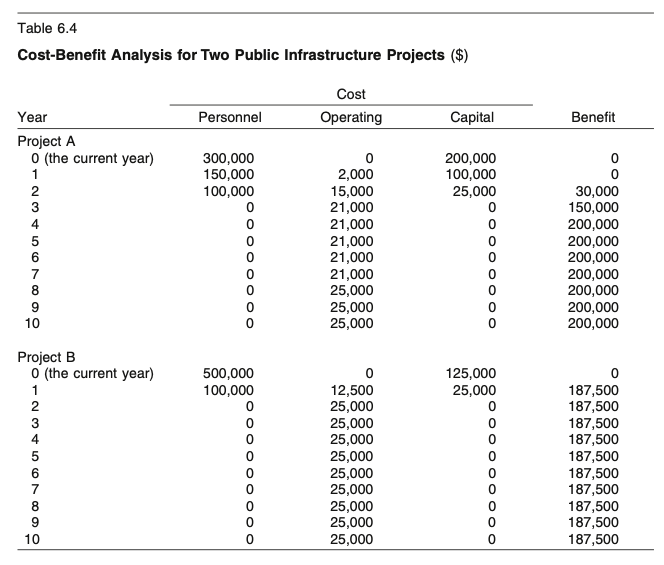
Table 6.4 shows cost and benefit flows of two public infrastructure projects.
In CBA, assumptions must be made about benefits, costs, the discount rate, and the lifetime of a project. In reality, these assumptions change. For example, in this chapters Sunny Village case study, the discount rate can be lower if the interest rate of the citys long-term debt is lower. The change of assumption inevitably changes CBA results. The type of analysis that examines the impact of assumption change on CBA results is called sensitivity analysis.
A. Now, assume that the discount rate is reduced from 10 percent to 5 percent, and everything else is unchangedconduct a CBA for Sunny Villages Diagnostic System.
B. Conduct a CBA in which the cost of ineffective replacement increases to $65, with everything else unchanged.
C. Finally, if the city decides to purchase QTS regardless of the CBA results, but wants to extend its lifetime of use until a positive NPV is produced, how long should the city keep QTS?
Table 6.4 Cost-Benefit Analysis for Two Public Infrastructure Projects ($) Personnel Cost Operating Capital Benefit 0 300,000 150,000 100,000 Year Project A 0 (the current year) 1 2 3 4 5 6 7 8 9 10 200,000 100,000 25,000 0 0 0 2,000 15,000 21,000 21,000 21,000 21,000 21,000 25,000 25,000 25,000 30,000 150,000 200,000 200,000 200,000 200,000 200,000 200,000 200,000 0 500,000 100,000 0 0 0 125,000 25,000 0 0 Project B 0 (the current year) 1 2 3 4 5 6 7 8 9 10 OOOOOO o 12,500 25,000 25,000 25,000 25,000 25,000 25,000 25,000 25,000 25,000 0 187,500 187,500 187,500 187,500 187,500 187,500 187,500 187,500 187,500 187,500 Table 6.4 Cost-Benefit Analysis for Two Public Infrastructure Projects ($) Personnel Cost Operating Capital Benefit 0 300,000 150,000 100,000 Year Project A 0 (the current year) 1 2 3 4 5 6 7 8 9 10 200,000 100,000 25,000 0 0 0 2,000 15,000 21,000 21,000 21,000 21,000 21,000 25,000 25,000 25,000 30,000 150,000 200,000 200,000 200,000 200,000 200,000 200,000 200,000 0 500,000 100,000 0 0 0 125,000 25,000 0 0 Project B 0 (the current year) 1 2 3 4 5 6 7 8 9 10 OOOOOO o 12,500 25,000 25,000 25,000 25,000 25,000 25,000 25,000 25,000 25,000 0 187,500 187,500 187,500 187,500 187,500 187,500 187,500 187,500 187,500 187,500Step by Step Solution
There are 3 Steps involved in it
Step: 1

Get Instant Access to Expert-Tailored Solutions
See step-by-step solutions with expert insights and AI powered tools for academic success
Step: 2

Step: 3
Ace Your Homework with AI
Get the answers you need in no time with our AI-driven, step-by-step assistance
Get Started
Financial Regulation In The EU From Resilience To Growth
Authors: Raphaël Douady , Clément Goulet, Pierre-Charles Pradier
1st Edition
3319442864,3319442872