Answered step by step
Verified Expert Solution
Question
1 Approved Answer
The purpose of this exercise is to examine the consequences of less acute insulin deficiency on blood glucose. Left untreated this condition results in


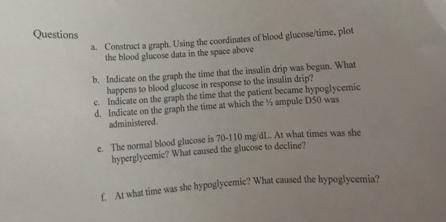
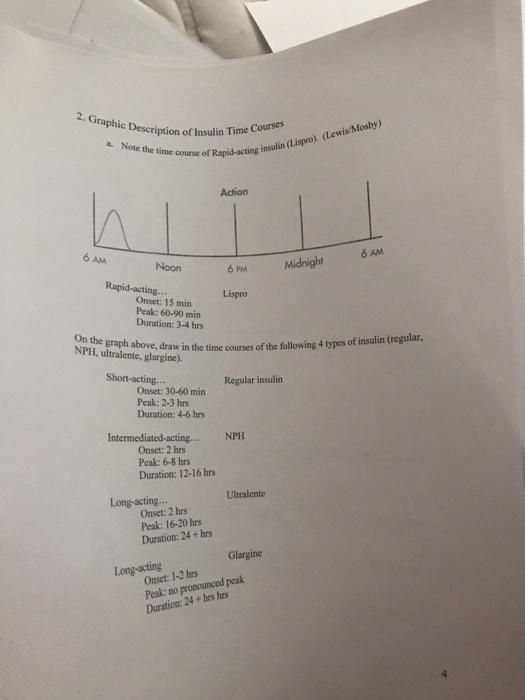
The purpose of this exercise is to examine the consequences of less acute insulin deficiency on blood glucose. Left untreated this condition results in hyperosmolar. hyperglycemic nonketotic coma (HHNK) and death. Ms HG, an 80 year old female patient was admitted to the ICU from a nursing home. She has a history of type 2 diabetes mellitus of 10 years duration and is normally controlled with Avandia (a hypoglycemic agent) and glucophage. She had a Foley catheter (urinary) in place. On admission she was febrile (101 F),delirious, and uroseptic. Her admitting blood glucose was 840 mg/dL.. And she displayed S&S of severe dehydration. A diagnosis of HHNK was quickly made. Upon admission at 8AM she was given an antibiotic and started on an insulin drip. Regular insulin in saline was administered IV. Blood glucose was determined hourly. In response to the insulin drip blood glucose levels declined throughout the day as illustrated by the data below. At 5 PM the patient appeared gray and clammy and the nurse suspected a hypoglycemic reaction. This suspicion was confirmed by a blood glucose level of 52. The patient was given ampule of D50 (a sugary supplement) thereby rapidly increasing the blood glucose to 100 mg/dL. In determining the cause of the hypoglycemia, the nurse noted a failure to change the IV from saline to a dextrose (sugary) solution at 3PM as the blood glucose was approaching normal. Time 8:00 9:00 10:00 11:00 12:00 1:00 2:00 3:00 4:00 5:00 6:00 7:00 8:00 Blood Glucose (mg/dL) 840 750 700 610 450 350 220 200 120 90 52 100 110 Questions a Construct a graph. Using the coordinates of blood glucose/time, plot the blood glucose data in the space above b. Indicate on the graph the time that the insulin drip was begun. What happens to blood glucose in response to the insulin drip? e. Indicate on the graph the time that the patient became hypoglycemic d. Indicate on the graph the time at which the ampule D50 was administered. e. The normal blood glucose is 70-110 mg/dL. At what times was she hyperglycemic? What caused the glucose to decline? f At what time was she hypoglycemic? What caused the hypoglycemia? 2. Graphic Description of Insulin Time Courses a. Note the time course of Rapid-acting insulin (Lispro). (Lewis/Mosby) h 6 AM Noon Rapid-acting... Onset: 15 min Peak: 60-90 min Duration: 3-4 hrs Short-acting... Onset: 30-60 min Peak: 2-3 hrs Duration: 4-6 hrs Intermediated-acting... Onset: 2 hrs Peak: 6-8 hrs Duration: 12-16 hrs Long-acting... On the graph above, draw in the time courses of the following 4 types of insulin (regular, NPH, ultralente, glargine). Onset: 2 hrs Peak: 16-20 hrs Duration: 24+ hrs Action Long-acting 6 PM Lispro Regular insulin NPH Ultralente Glargine Midnight Onset: 1-2 hrs Peak: no pronounced peak Duration: 24+ hrs hrs 6 AM
Step by Step Solution
★★★★★
3.46 Rating (162 Votes )
There are 3 Steps involved in it
Step: 1
A C B b The glucose level starts to drop as soon as the insul...
Get Instant Access to Expert-Tailored Solutions
See step-by-step solutions with expert insights and AI powered tools for academic success
Step: 2

Step: 3

Ace Your Homework with AI
Get the answers you need in no time with our AI-driven, step-by-step assistance
Get Started


