Answered step by step
Verified Expert Solution
Question
1 Approved Answer
The purpose of this exercise is to track the investment performance of purchasing some shares in the company that you are examining. I am
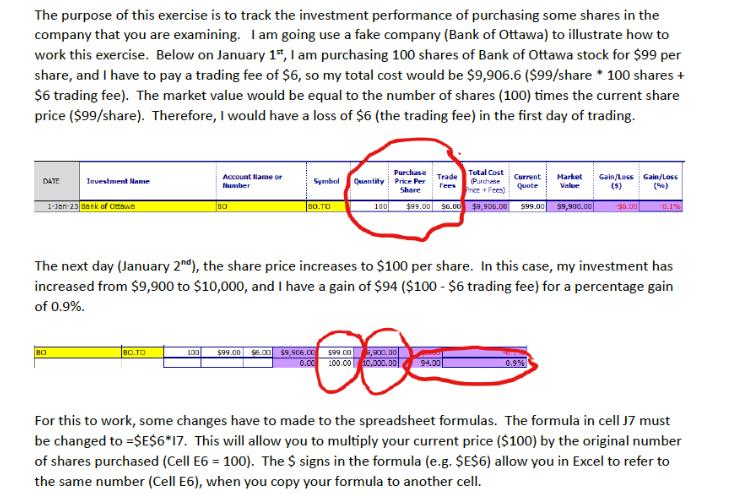
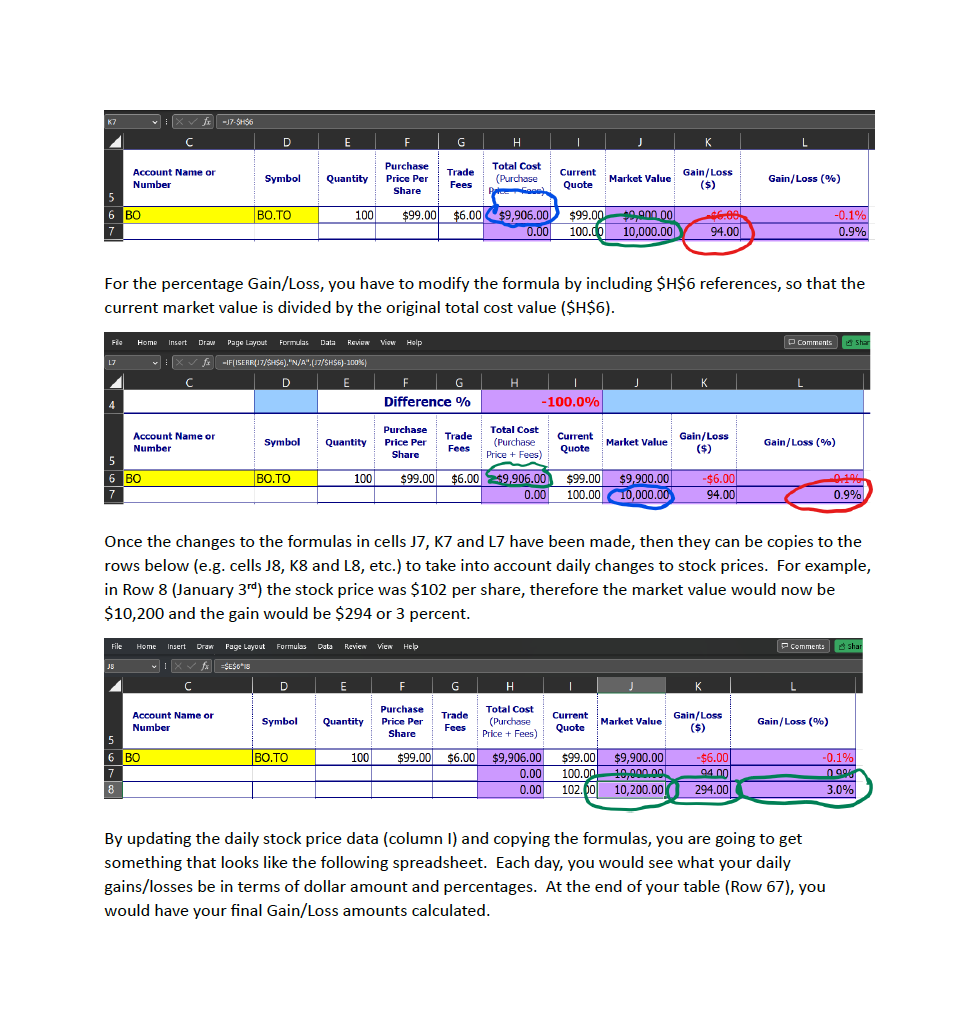
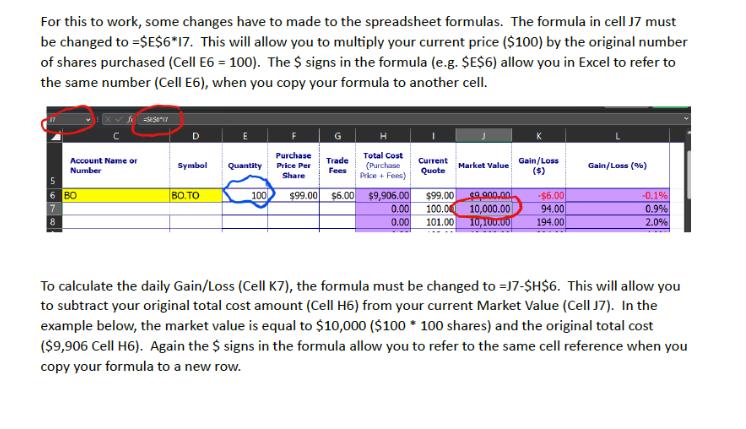
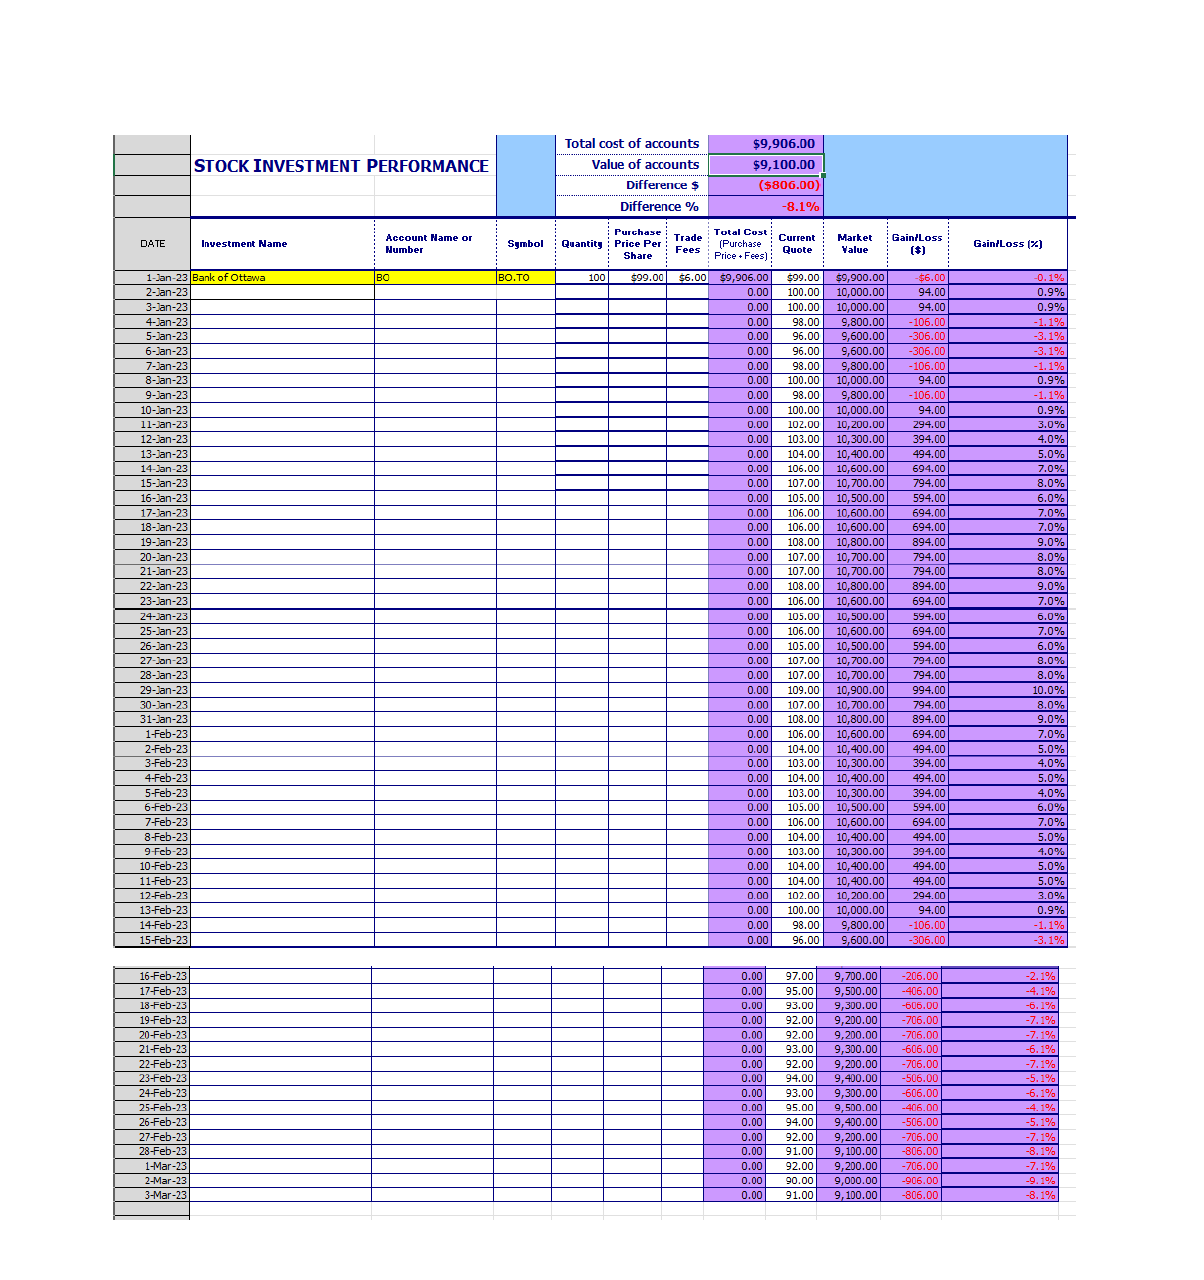
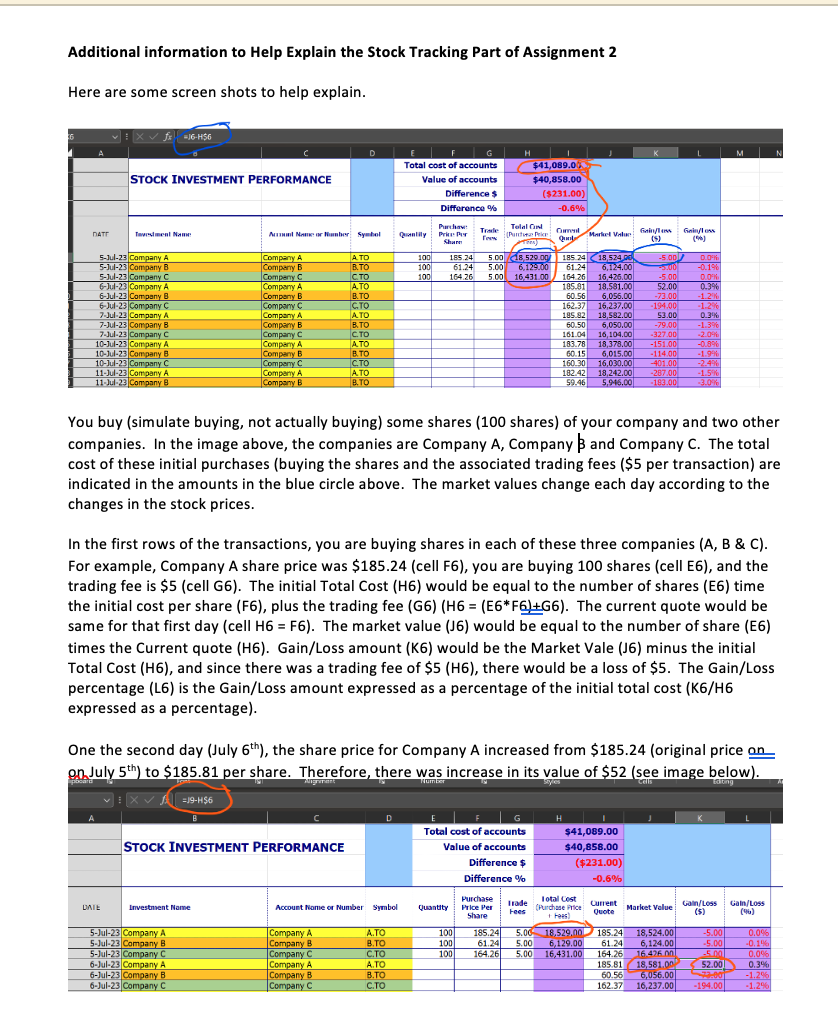
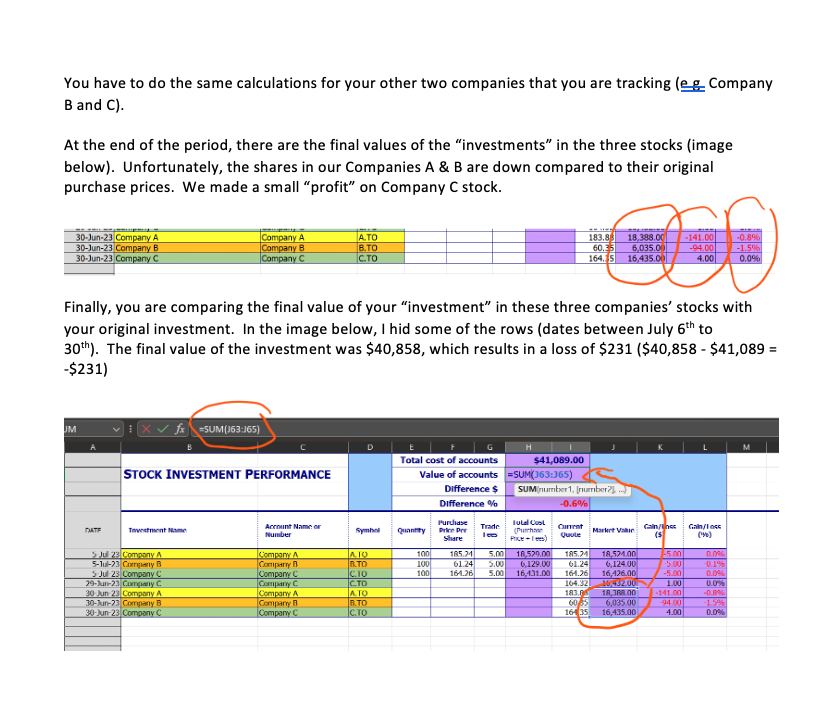
The purpose of this exercise is to track the investment performance of purchasing some shares in the company that you are examining. I am going use a fake company (Bank of Ottawa) to illustrate how to work this exercise. Below on January 1, I am purchasing 100 shares of Bank of Ottawa stock for $99 per share, and I have to pay a trading fee of $6, so my total cost would be $9,906.6 ($99/share *100 shares + $6 trading fee). The market value would be equal to the number of shares (100) times the current share price ($99/share). Therefore, I would have a loss of $6 (the trading fee) in the first day of trading. DATE Investment Name 1-Jan-23 Bank of Ottawe Account Name or Number Symbol Purchase Quantity Price Per Trade Fees Share BO 50.TO 100 Total Cost Purchase Price + Fees) $99.00 $6.00 $9,900.00 $99.00 $9,900.00 Current Market Gain/Loss Gain/Loss Quote Value (5) (%) 30.00 0.1 The next day (January 2nd), the share price increases to $100 per share. In this case, my investment has increased from $9,900 to $10,000, and I have a gain of $94 ($100 - $6 trading fee) for a percentage gain of 0.9%. BO BO.TO 100 $99.00 $6.00 $9.906.00 $99.00 0.00 100.00 5,900, 30 10,000.00 94.00 0.9% For this to work, some changes have to made to the spreadsheet formulas. The formula in cell J7 must be changed to =$E$6*17. This will allow you to multiply your current price ($100) by the original number of shares purchased (Cell E6 = 100). The $ signs in the formula (e.g. $E$6) allow you in Excel to refer to the same number (Cell E6), when you copy your formula to another cell. K7 fx -J7-5H56 C D E F G H K Account Name or Number Symbol Quantity Purchase Price Per Share Trade Fees Total Cost (Purchase Price Face) Current Quote Market Value Gain/Loss ($) Gain/Loss (%) 5 6 BO BO.TO 100 $99.00 $6.00 $9,906.00 $99.00 $9,900.00|| 0.00 100.00 10,000.00 -0.1% 94.00 0.9% For the percentage Gain/Loss, you have to modify the formula by including $H$6 references, so that the current market value is divided by the original total cost value ($H$6). 17 File Home Insert Draw Page Layout Formulas Data Review View Help | fx =IF(ISEAR(17/SH$6), "N/A",(17/SH$6)-100%) Comments Shar C E F H K Difference % -100.0% Account Name or Number Symbol Quantity Purchase Price Per Share Trade Fees Total Cost (Purchase Price + Fees) Current Quote Market Value Gain/Loss ($) Gain/Loss (%) BO.TO 100 $99.00 $6.00 $9.906.00 $99.00 $9,900.00 0.00 100.00 10,000.00 -$6.00 94.00 6 BO 7 0.9% Once the changes to the formulas in cells J7, K7 and L7 have been made, then they can be copies to the rows below (e.g. cells J8, K8 and L8, etc.) to take into account daily changes to stock prices. For example, in Row 8 (January 3rd) the stock price was $102 per share, therefore the market value would now be $10,200 and the gain would be $294 or 3 percent. File Home Insert Draw Page Layout Formulas Data Review View Help Comments Shar JB C E F G H K Account Name or Number Symbol Quantity Purchase Price Per Share Trade Fees 5 Total Cost (Purchase Price + Fees) Current Market Value Gain/Loss Quote ($) Gain/Loss (%) 6 BO BO.TO 100 $99.00 $6.00 $9,906.00 7 8 $99.00 $9,900.00 0.00 100.00 10,000.00 94.00 0.00 102.00 10,200.00 294.00 -$6.00 -0.1% 0.9% 3.0% By updating the daily stock price data (column I) and copying the formulas, you are going to get something that looks like the following spreadsheet. Each day, you would see what your daily gains/losses be in terms of dollar amount and percentages. At the end of your table (Row 67), you would have your final Gain/Loss amounts calculated. For this to work, some changes have to made to the spreadsheet formulas. The formula in cell J7 must be changed to =$E$6*17. This will allow you to multiply your current price ($100) by the original number of shares purchased (Cell E6 = 100). The $ signs in the formula (e.g. $E$6) allow you in Excel to refer to the same number (Cell E6), when you copy your formula to another cell. Account Name or Number Symbol Quantity Purchase Price Per Share Trade Fees Total Cost (Purchase Price + Fees) Current Quote Market Value Gain/Loss ($) Gain/Loss (%) BO.TO 100 $99.00 $6.00 $9,906.00 $99.00 0.00 100.00 10,000.00 0.00 101.00 10,100.00 ea 900.00 -$6.00 94.00 194.00 6 BO 8 -0.1% 0.9% 2.0% To calculate the daily Gain/Loss (Cell K7), the formula must be changed to -17-$H$6. This will allow you to subtract your original total cost amount (Cell H6) from your current Market Value (Cell J7). In the example below, the market value is equal to $10,000 ($100 * 100 shares) and the original total cost ($9,906 Cell H6). Again the $ signs in the formula allow you to refer to the same cell reference when you copy your formula to a new row. STOCK INVESTMENT PERFORMANCE Total cost of accounts $9,906.00 Value of accounts $9,100.00 Difference $ Difference % ($806.00) -8.1% DATE Investment Name Account Name or Number Symbol Quantity Purchase Price Pe Share Trade Fees Total Cost Current (Purchase Price + Fees) Quote Market Gain/Loss Value ($) Gain/Loss (%) 1-Jan-23 Bank of Ottawa 2-Jan-23 3-Jan-23 4-Jan-23 5-Jan-23 6-Jan-23 7-Jan-23 8-Jan-23 9-Jan-23 BO BO.TO 100 $99.00 $6.00 $9,906.00 $99.00 $9,900.00 0.00 100.00 0.00 100.00 0.00 98.00 -$6.00 -0.1% 10,000.00 94.00 0.9% 10.000.00 94.00 0.9% 9,800.00 -106.00 -1.1% 10-Jan-23 0.00 96.00 9,600.00 0.00 96.00 0.00 98.00 9,800.00 0.00 100.00 10,000.00 0.00 98.00 9,800.00 0.00 100.00 10,000.00 -306.00 -3.1% 9.600.00 -306.00 -3.1% -106.00 -1.1% 94.00 0.9% -106.00 -1.1% 94.00 0.9% 11-Jan-23 12-Jan-23 13-Jan-23 14-Jan-23 15-Jan-23 16-Jan-23 17-Jan-23 18-Jan-23 19-Jan-23 20-Jan-23 21-Jan-23 0.00 0.00 22-Jan-23 23-Jan-23 24-Jan-23 25-Jan-23 0.00 102.00 10,200.00 0.00 103.00 10,300.00 0.00 104.00 10,400.00 0.00 106.00 10,600.00 0.00 107.00 10,700.00 0.00 105.00 10,500.00 106.00 10,600.00 106.00 10,600.00 0.00 108.00 10,800.00 0.00 107.00 10,700.00 0.00 107.00 10,700.00 0.00 108.00 10,800.00 294.00 3.0% 394.00 4.0% 494.00 5.0% 694.00 7.0% 794.00 8.0% 594.00 6.0% 694.00 7.0% 694.00 7.0% 894.00 9.0% 794.00 8.0% 794.00 8.0% 894.00 9.0% 0.00 106.00 10,600.00 694.00 7.0% 0.00 105.00 10,500.00 $94.00 6.0% 0.00 106.00 10,600.00 694.00 7.0% 26-Jan-23 0.00 105.00 10,500.00 594.00 6.0% 27-Jan-23 28-Jan-23 29-Jan-23 30-Jan-23 31-Jan-23 0.00 0.00 107.00 10,700.00 0.00 107.00 10,700.00 0.00 109.00 10,900.00 0.00 107.00 10,700.00 108.00 10,800.00 794.00 8.0% 794.00 8.0% 994.00 10.0% 794.00 8.0% 894.00 9.0% 1-Feb-23 0.00 106.00 10,600.00 694.00 7.0% 2-Feb-23 3-Feb-23 4-Feb-23 5-Feb-23 6-Feb-23 7-Feb-23 8-Feb-23 9-Feb-23 10-Feb-23 11-Feb-23 12-Feb-23 0.00 104.00 10,400.00 494.00 10,300. 0.00 104.00 10,400.00 494.00 5.0% 0.00 103.00 10,300.00 394.00 4.0% 5.0% 0.00 103.00 394.00 4.0% 0.00 105.00 10,500.00 0.00 106.00 10,600.00 0.00 104.00 10,400.00 0.00 103.00 10,300.00 0.00 104.00 10,400.00 0.00 104.00 10,400.00 0.00 102.00 10,200.00 594.00 6.0% 694.00 7.0% 494.00 5.0% 394.00 4.0% 494.00 5.0% 494.00 5.0% 294.00 3.0% 13-Feb-23 0.00 14-Feb-23 15-Feb-23 0.00 100.00 10,000.00 98.00 9,800.00 0.00 96.00 9,600.00 94.00 0.9% -106.00 -1.1% -306.00 -3.1% 16-Feb-23 0.00 97.00 9,700.00 -206.00 -2.1% 17-Feb-23 0.00 95.00 9,500.00 -406.00 -4.1% 18-Feb-23 19-Feb-23 20-Feb-23 21-Feb-23 22-Feb-23 23-Feb-23 24-Feb-23 25-Feb-23 26-Feb-23 27-Feb-23 28-Feb-23 1-Mar-23 0.00 93.00 9,300.00 -606.00 6.1% 0.00 92.00 9,200.00 -706.00 -7.1% 0.00 92.00 9,200.00 -706.00 0.00 93.00 9,300.00 -606.00 0.00 92.00 9,200.00 -706.00 0.00 94.00 9,400.00 0.00 93.00 9,300.00 -7.1% -6.1% -7.1% -506.00 -5.1% -606.00 -6.1% 0.00 95.00 9.500.00 -406.00 -4.1% 0.00 94.00 9,400.00 -506.00 0.00 92.00 9,200.00 -706.00 0.00 91.00 9.100.00 0.00 92.00 9,200.00 -706.00 -5.1% -7.1% -806.00 -8.1% -7.1% 2-Mar-23 0.00 90.00 9,000.00 -906.00 -9.1% 3-Mar-23 0.00 91.00 9,100.00 -806.00 -8.1% Additional information to Help Explain the Stock Tracking Part of Assignment 2 Here are some screen shots to help explain. -16-H56 H Total cost of accounts $41,089.05 STOCK INVESTMENT PERFORMANCE Value of accounts $40,858.00 Difference $ ($231.00) Difference % -0.6% DATE Investment Name At Name or Number Symbol Quantity Purcha Price Per Share Trade Telan (Puntes Price Cumul Qual Gain/Lo Gain/lo Market Value (5) (46) 5-Jul-23 Company A Company A ATO 5-Jul-23 Company B Company B B.TO 5-Jul-23 Company C Company C CTO 100 100 100 185.24 5.00 18,529.00/ 185.24 18,524.06 61.24 5.00 6,129.00 61.24 164.26 5.00 16,431.00 164.26 -5.00 0.0% 6,124,00 -5.00 -0.1% 6-Jul-23 Company A Company A ATO 6-Jul-23 Company B Company B B.TO 6-Jul-23 Company C Company C C.TO 7-Jul-23 Company A Company A ATO 7-Jul-23 Company B Company B B.TO 7-Jul-23 Company C Company C C.TO 10-Jul-23 Company A Company A ATO 10-Jul-23 Company B Company B B.TO 10-Jul-23 Company C Company C CTO 11-Jul-23 Company A Company A ATO 11-Jul-23 Company B Company B B.TO 16,426,00 185.81 18.581.00 60.56 6,056.00 162.37 16,237,00 185.82 18,582.00 60.50 6,050.00 161.04 16,104.00 183.78 60.15 6,015.00 160.30 16,030,00 -401.00 182.42 18,242,00 -287.00 59.46 5,946.00 -183.00 -5.00 0.0% 52.00 0.3% -73.00 -1.2% -194.00 -1.2% 53.00 0.3% -79.00 -1.3% -327.00 -2.0% 18,378,00 -151.00 -0.8% -114.00 -1.9% -2.4% -1.5% -3.0% You buy (simulate buying, not actually buying) some shares (100 shares) of your company and two other companies. In the image above, the companies are Company A, Company B and Company C. The total cost of these initial purchases (buying the shares and the associated trading fees ($5 per transaction) are indicated in the amounts in the blue circle above. The market values change each day according to the changes in the stock prices. In the first rows of the transactions, you are buying shares in each of these three companies (A, B & C). For example, Company A share price was $185.24 (cell F6), you are buying 100 shares (cell E6), and the trading fee is $5 (cell G6). The initial Total Cost (H6) would be equal to the number of shares (E6) time the initial cost per share (F6), plus the trading fee (G6) (H6 = (E6* F6)+G6). The current quote would be same for that first day (cell H6 = F6). The market value (J6) would be equal to the number of share (E6) times the Current quote (H6). Gain/Loss amount (K6) would be the Market Vale (J6) minus the initial Total Cost (H6), and since there was a trading fee of $5 (H6), there would be a loss of $5. The Gain/Loss percentage (L6) is the Gain/Loss amount expressed as a percentage of the initial total cost (K6/H6 expressed as a percentage). One the second day (July 6th), the share price for Company A increased from $185.24 (original price on on July 5th) to $185.81 per share. Therefore, there was increase in its value of $52 (see image below). Number Cells Editing =19-456 H Total cost of accounts $41,089.00 STOCK INVESTMENT PERFORMANCE Value of accounts Difference $ Difference % $40,858.00 ($231.00) -0.6% DATE Investment Name Account Name or Number Symbol Quantity Purchase Price Per Share Trade Fees Total Cost (Purchase Price + Fees) Current Quote Market Value Gain/Loss (5) Gain/Loss (u) 5-Jul-23 Company A Company A A.TO 100 185.24 5.00 5-Jul-23 Company B Company B B.TO 100 5-Jul-23 Company C Company C C.TO 100 6-Jul-23 Company A Company A A.TO 6-Jul-23 Company B Company B B.TO 18,529,00 185.24 18,524.00 61.24 5.00 6,129.00 61.24 164.26 5.00 16,431.00 164.26 16.426.00 185.81 18,581.00 60.56 6,056.00 -5.00 0.0% 6,124.00 -5.00 -0.1% -5.00 0.0% 52.00 0.3% 23.00 -1.2% 6-Jul-23 Company C Company C C.TO 162.37 16,237.00 -194.00 -1.2% You have to do the same calculations for your other two companies that you are tracking (eg Company B and C). At the end of the period, there are the final values of the "investments" in the three stocks (image below). Unfortunately, the shares in our Companies A & B are down compared to their original purchase prices. We made a small "profit" on Company C stock. 30-Jun-23 Company A 30-Jun-23 Company B 30-Jun-23 Company C Company A Company B Company C A.TO B.TO C.TO 183.88 60.35 6,035.00 164.15 16,435.00 18,388.00 -141.00 -0.8% -94.00 -1.5% 4.00 0.0% Finally, you are comparing the final value of your "investment" in these three companies' stocks with your original investment. In the image below, I hid some of the rows (dates between July 6th to 30th). The final value of the investment was $40,858, which results in a loss of $231 ($40,858 - $41,089 = -$231) UM =SUM(163:165) STOCK INVESTMENT PERFORMANCE D Total cost of accounts $41,089.00 Value of accounts =SUM(163:365) Difference $ Difference % SUM(number1, number?], ...)] -0.6% DATE Tnvestment Name Account Name or Number Symbol Quantity Purchase Price Pr Trade Share Total Cust (Purchme Price+) Current Quote Market Value Gain/Insc Gain/Loss (5 (140) 5 Jul 23 Company A Company A ATO 100 5-Jul-23 Company B Company B B.TO 100 5-Jul-23 Company C Company C C.10 100 185.24 5.00 61.24 5.00 161.26 5.00 18,529.00 185.24 18,521.00 -5.00 0.0% 6,129.00 16,431.00 61.24 6,124.00 5.00 0.1% 164.26 16,426.00 -5.00 0.0% 29-Jun-23 Company C. Company C CTO 30-Jun 23 Company A Company A ATO 164.32 183.8 18,388.00 10,432.00 1.00 0.0% -141.00 -0.8% 30-Jun-23 Company B Company B B.TO 30-Jun-23 Company C Company C C.TO 6085 6,035.00 16435 16,435.00 -94.00 -1.5% 4.00 0.0%
Step by Step Solution
There are 3 Steps involved in it
Step: 1

Get Instant Access to Expert-Tailored Solutions
See step-by-step solutions with expert insights and AI powered tools for academic success
Step: 2

Step: 3

Ace Your Homework with AI
Get the answers you need in no time with our AI-driven, step-by-step assistance
Get Started


