Answered step by step
Verified Expert Solution
Question
1 Approved Answer
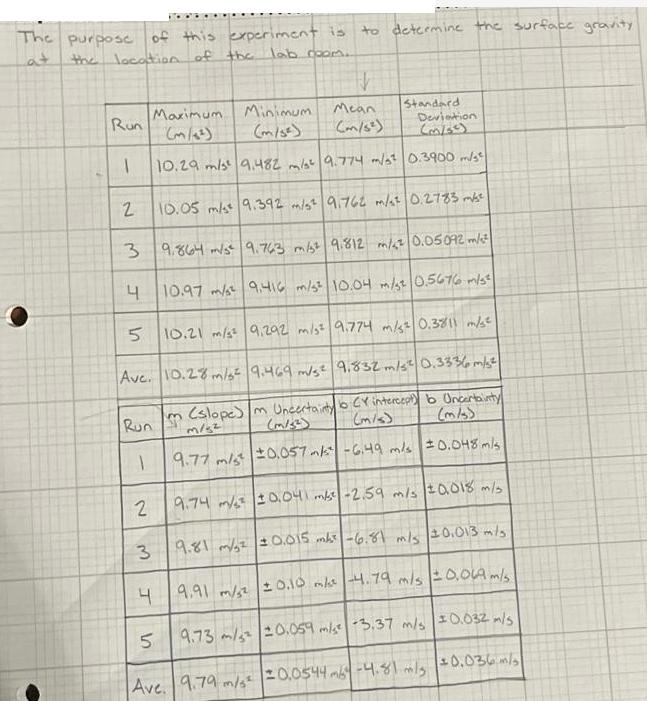
The purpose of this experiment is the location of the. at lab room.. Run 1 2 Maximum Deviation (m/8) (m/s) 10.29 m/s 9.482 m/s


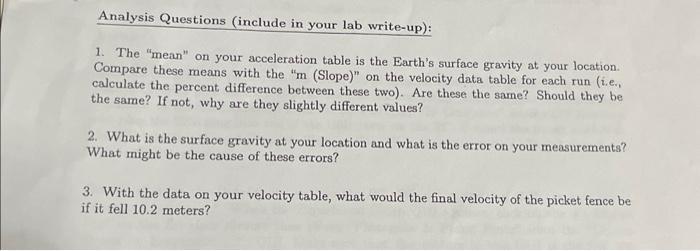
The purpose of this experiment is the location of the. at lab room.. Run 1 2 Maximum Deviation (m/8) (m/s) 10.29 m/s 9.482 m/s 9.774 m/s 0.3900 m/s 10.05 m/s 9.392 m/s 9.762 m/s 0.2783 m 3 9.864 m/s 9.763 m/s 9.812 m/42 0.05092 m/s 4 10.97 m/s 9,416 m/s 10.04 m/s2 0.5676 m/s 5 10.21 m/s 9,292 m/s 9.774 m/s 0.3811 m/s Ave. 10.28 m/s 9.469 m/s 9,832 m/s0.3336 m/s m (slope) m Uncertainty to CY intercept) b Uncertainty S (m/s) (m/s2) (m/s) m/s2 9.77 m/s 0.057 mk -6.49 m/s 0.048 m/s Run 1 2 3 Minimum (m/s) to determine the surface gravity HV Mean (m/s) Standard 9.74 / 0.04 m/s -2.59 m/s 0018 m/s 9.81 m/32 0,015 mk -6.81 m/s 20.013 m/s 9.91 m/s2 0.10 m/ -4.79 m/s = 0,069 m/s 9.73 / 20.059 m/s -3.37 m/s 10.032 m/s 4 5 Ave. 9.79 m/s 20.0544m64 -4.81 m/s 10.036 m/s Analysis Questions (include in your lab write-up): 1. The "mean" on your acceleration table is the Earth's surface gravity at your location. Compare these means with the "m (Slope)" on the velocity data table for each run (i.e., calculate the percent difference between these two). Are these the same? Should they be the same? If not, why are they slightly different values? 2. What is the surface gravity at your location and what is the error on your measurements? What might be the cause of these errors? 3. With the data on your velocity table, what would the final velocity of the picket fence be if it fell 10.2 meters?
Step by Step Solution
There are 3 Steps involved in it
Step: 1
Analysis Answers Comparing the means of the acceleration and velocity data tables The mean of the acceleration table is 979 mswhile the mean of the ve...
Get Instant Access to Expert-Tailored Solutions
See step-by-step solutions with expert insights and AI powered tools for academic success
Step: 2

Step: 3

Ace Your Homework with AI
Get the answers you need in no time with our AI-driven, step-by-step assistance
Get Started


