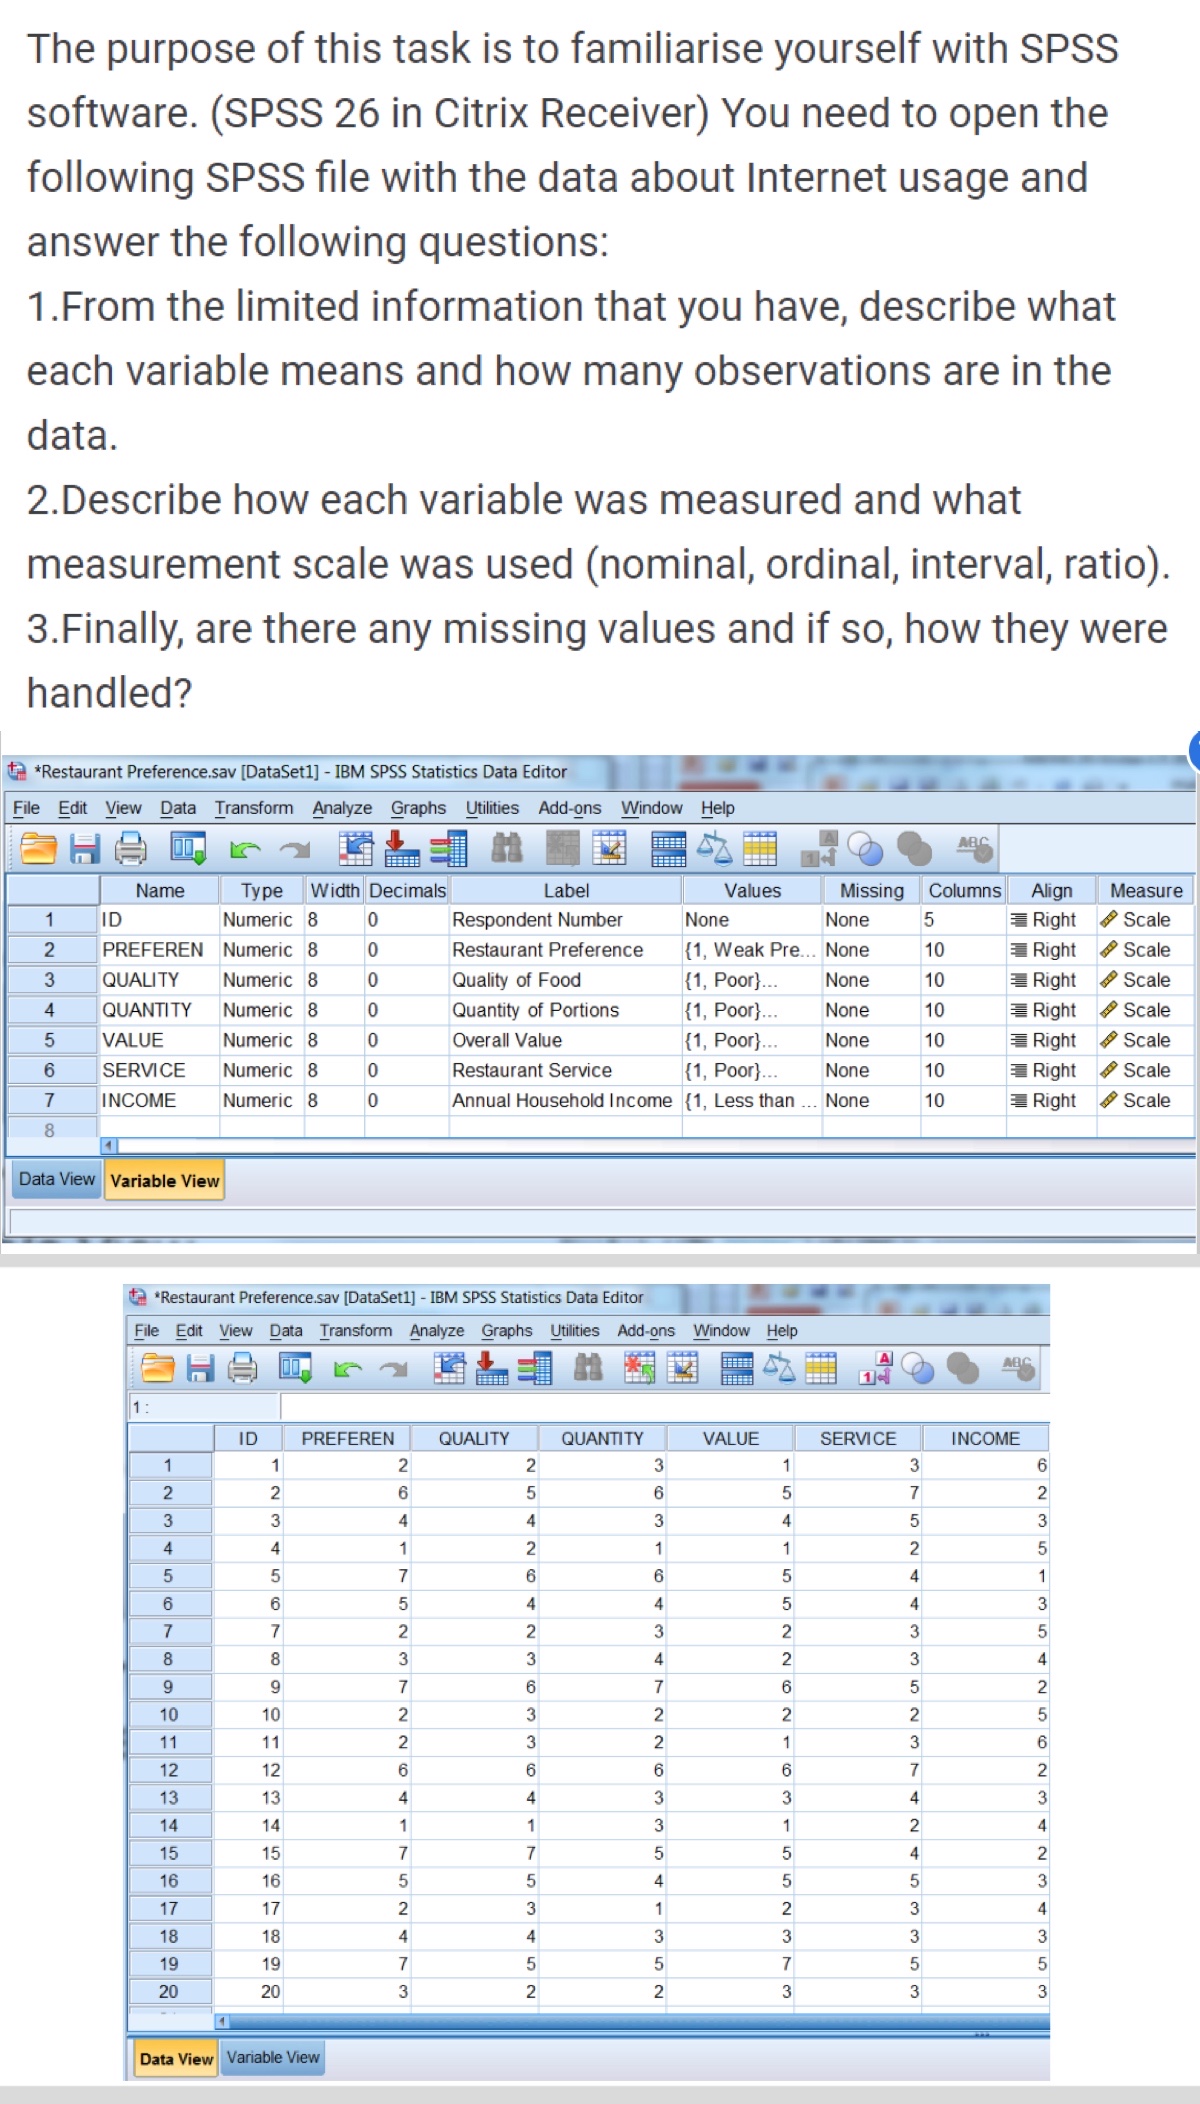
The purpose of this task is to familiarise yourself with SPSS software. (SPSS 26 in Citrix Receiver) You need to open the following SPSS file with the data about Internet usage and answer the following questions: 1. From the limited information that you have, describe what each variable means and how many observations are in the data. 2.Describe how each variable was measured and what measurement scale was used (nominal, ordinal, interval, ratio). 3. Finally, are there any missing values and if so, how they were handled? *Restaurant Preference.sav [DataSet1] - IBM SPSS Statistics Data Editor File Edit View Data Transform Analyze Graphs Utilities Add-ons Window Help ABC Name Type Width Decimals Label Values Missing Columns Align Measure 1 ID Numeric 8 Respondent Number None None 5 Right Scale 2 PREFEREN Numeric 8 Restaurant Preference (1, Weak Pre... None 10 Right Scale 3 QUALITY Numeric 8 O Quality of Food (1, Poor].. None 10 Right Scale A QUANTITY Numeric 8 Quantity of Portions (1, Poor}... None 10 Right Scale 5 VALUE Numeric 8 0 Overall Value (1, Poor].. None 10 Right Scale 6 SERVICE Numeric 8 0 Restaurant Service (1, Poor]... None 10 Right Scale 7 INCOME Numeric 8 Annual Household Income {1, Less than ... None 10 _Right Scale 8 Data View Variable View "Restaurant Preference.sav [DataSet1] - IBM SPSS Statistics Data Editor File Edit View Data Transform Analyze Graphs Utilities Add-ons Window Help A 14 1 : ID PREFEREN QUALITY QUANTITY VALUE SERVICE INCOME - WO W A ONAUN O J A W N J SO DO YOU A W N G G A W N 3 6 6 0 VO U A W N W Un W W U A N A Y W N CI W W A A N O V W W Y A NU - - A O N N J W N G VJ AD N W U W A W N A W N O CI N A C W - C W N NONGO - WO-NONNOUS NOW - A UT W W O N N V A W. N UAW UN - AO WWOWN 17 18 19 20 20 Data View Variable View