

Question
The Purpose This is an individual assignment designed to enhance students knowledge in the following areas: an understanding of and ability to identify the financial
The Purpose
This is an individual assignment designed to enhance students knowledge in the following areas: an understanding of and ability to identify the financial risks faced by individuals and corporations; an ability to undertake statistical analysis, including calculation of alternative portfolio risk measures and statistics in Excel; familiarity with the construction of tables and graphics and their integration into written reports; and high-level written communication skills.
Information:
Your employer, an Australian-based investment bank, has issued a Structured Financial Product (SFP) to high net worth investors. You have been requested to determine the risk exposure to the bank and to hedge the market financial risks associated with the payoff at maturity on the SFP.
You have the following information on this SFP, as well as other information on key financial variables:
- The face value of the SFP is USD25,000
- The payoff is due in one year
- Payoff at maturity is max{USD25,000, [(SP500T/SP5000 )x USD25,000]}
- SP500T represents the value of the S&P 500 Index at maturity of the investment product and SP5000 the value of the S&P 500 Index at inception of the SFP (i.e., the end of June 2020)
- USD/AUD represents the US dollar/Australian dollar exchange rate (price of AUD 1 in USD)
- The discount rate for this SFP is the yield on the comparable U.S. government bond plus 200 basis points
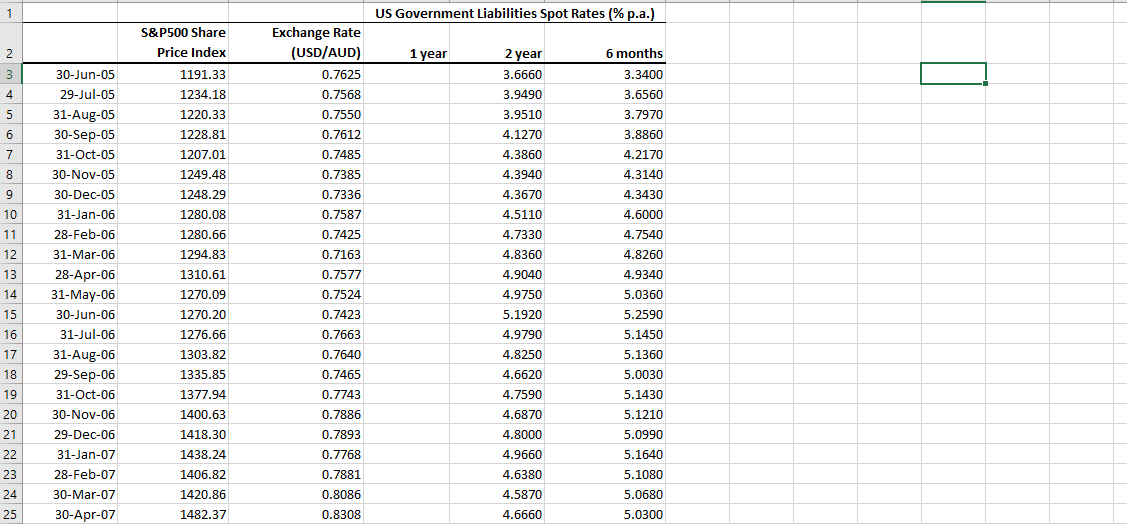
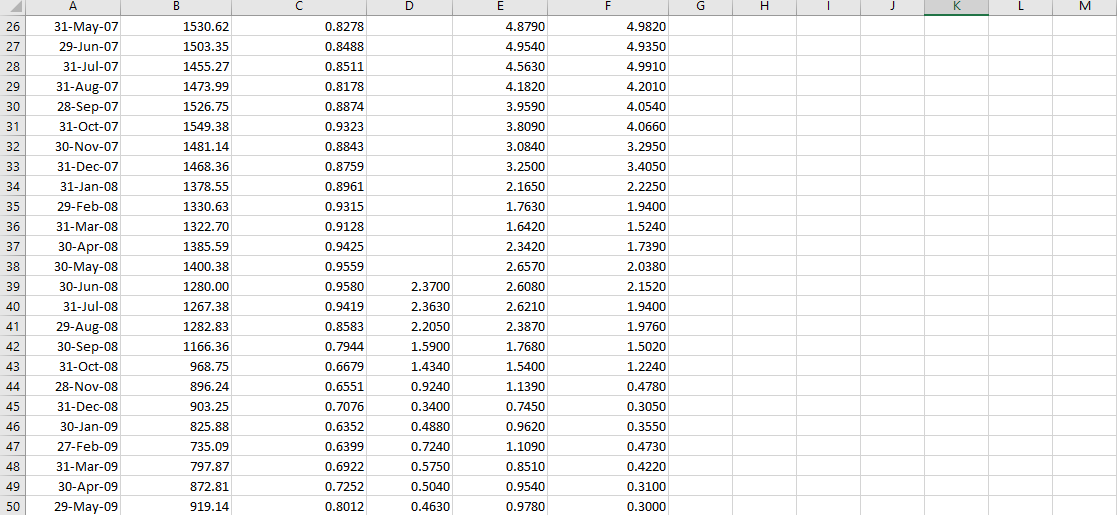
- You have been provided with time series data (as of the end of June 2020, the date you will assume as now/today for undertaking your calculations) in the form of the yield on U.S. government bonds (% p.a.), the USD/AUD exchange rate, and the value of the S&P 500 Index (see the spreadsheet provided with the Assignment DATA.xlsx
The Task
Prepare a brief (i.e., no more than 3 pages) report in which you address the following:
- You are informed that there might be resistances within the management to your risk management activities. What could their argument be and what would be your counter arguments?
- Your bank is especially concerned about extreme adverse movements associated with the payoff of this SFP. Provide estimates on the potential exposure(s) associated with the payoff at maturity of the SFP.
(Hint 1: the exposure must relate to any amount in excess of USD25,000 in AUD that the investment bank may be required to pay out at maturity and should consider both likely payoffs and the probabilities of these payoffs.)
(Hint 2: you should consider measures such as value-at-risk (VaR) to assist you in determining the exposure(s). You can ignore the time value of money for this part since we are exclusively talking about the payoffs at maturity. Any proper attempts to further assess the extreme risk will be rewarded.)
- Your macroeconomic team has estimated that the escalation or ending of the ongoing U.S.-China trade war in 6 months would significantly impact this SFP. The escalation would cause the S&P500 index to decline by 10% and the AUD to appreciate against the USD by 5%. The ending would have the opposite effect on the equity and currency markets. Briefly outline the value of the SFP given these two scenarios. Propose another scenario that would significantly impact the SFP.
(Hint 3: keep the quantitative part simple. You should justify your proposed scenario without calculations.)
- Provide a brief, but critical, evaluation of the limitations and model risks of each of the methods that you have used to develop the estimates in part a) and b).
- Briefly outline how you would hedge against the market risk exposure(s) associated with the payoff on this structured investment product.
(Hint 4: you should identify the portfolio of simple contracts that you would use to hedge this exposure.)
What to Submit and When?
Each student should submit one copy of the following via learn online:
- A WORD or PDF file (of no more than 3 pages) by 5pm, 6 Nov 2020. Supporting materials such as tables, figures, references, and appendices do not count towards the page limit. There is no word limit. The word limit shown in the course outline is the word-equivalent limit. It does not strictly apply to word count because we have quantitative elements.
- An Excel file for calculation references by 5pm, 6 Nov 2020. Note that this file is not graded. The grader may reference the Excel file if the main report is unclear or ambiguous. Therefore, there is minimum expectation in terms of formatting and explanation.
Step by Step Solution
There are 3 Steps involved in it
Step: 1

Get Instant Access to Expert-Tailored Solutions
See step-by-step solutions with expert insights and AI powered tools for academic success
Step: 2

Step: 3
Ace Your Homework with AI
Get the answers you need in no time with our AI-driven, step-by-step assistance
Get Started
Materiality In Financial Reporting An Integrative Perspective
Authors: Francesco Bellandi
1st Edition
178743737X, 9781787437371