

Answered step by step
Verified Expert Solution
Question
1 Approved Answer
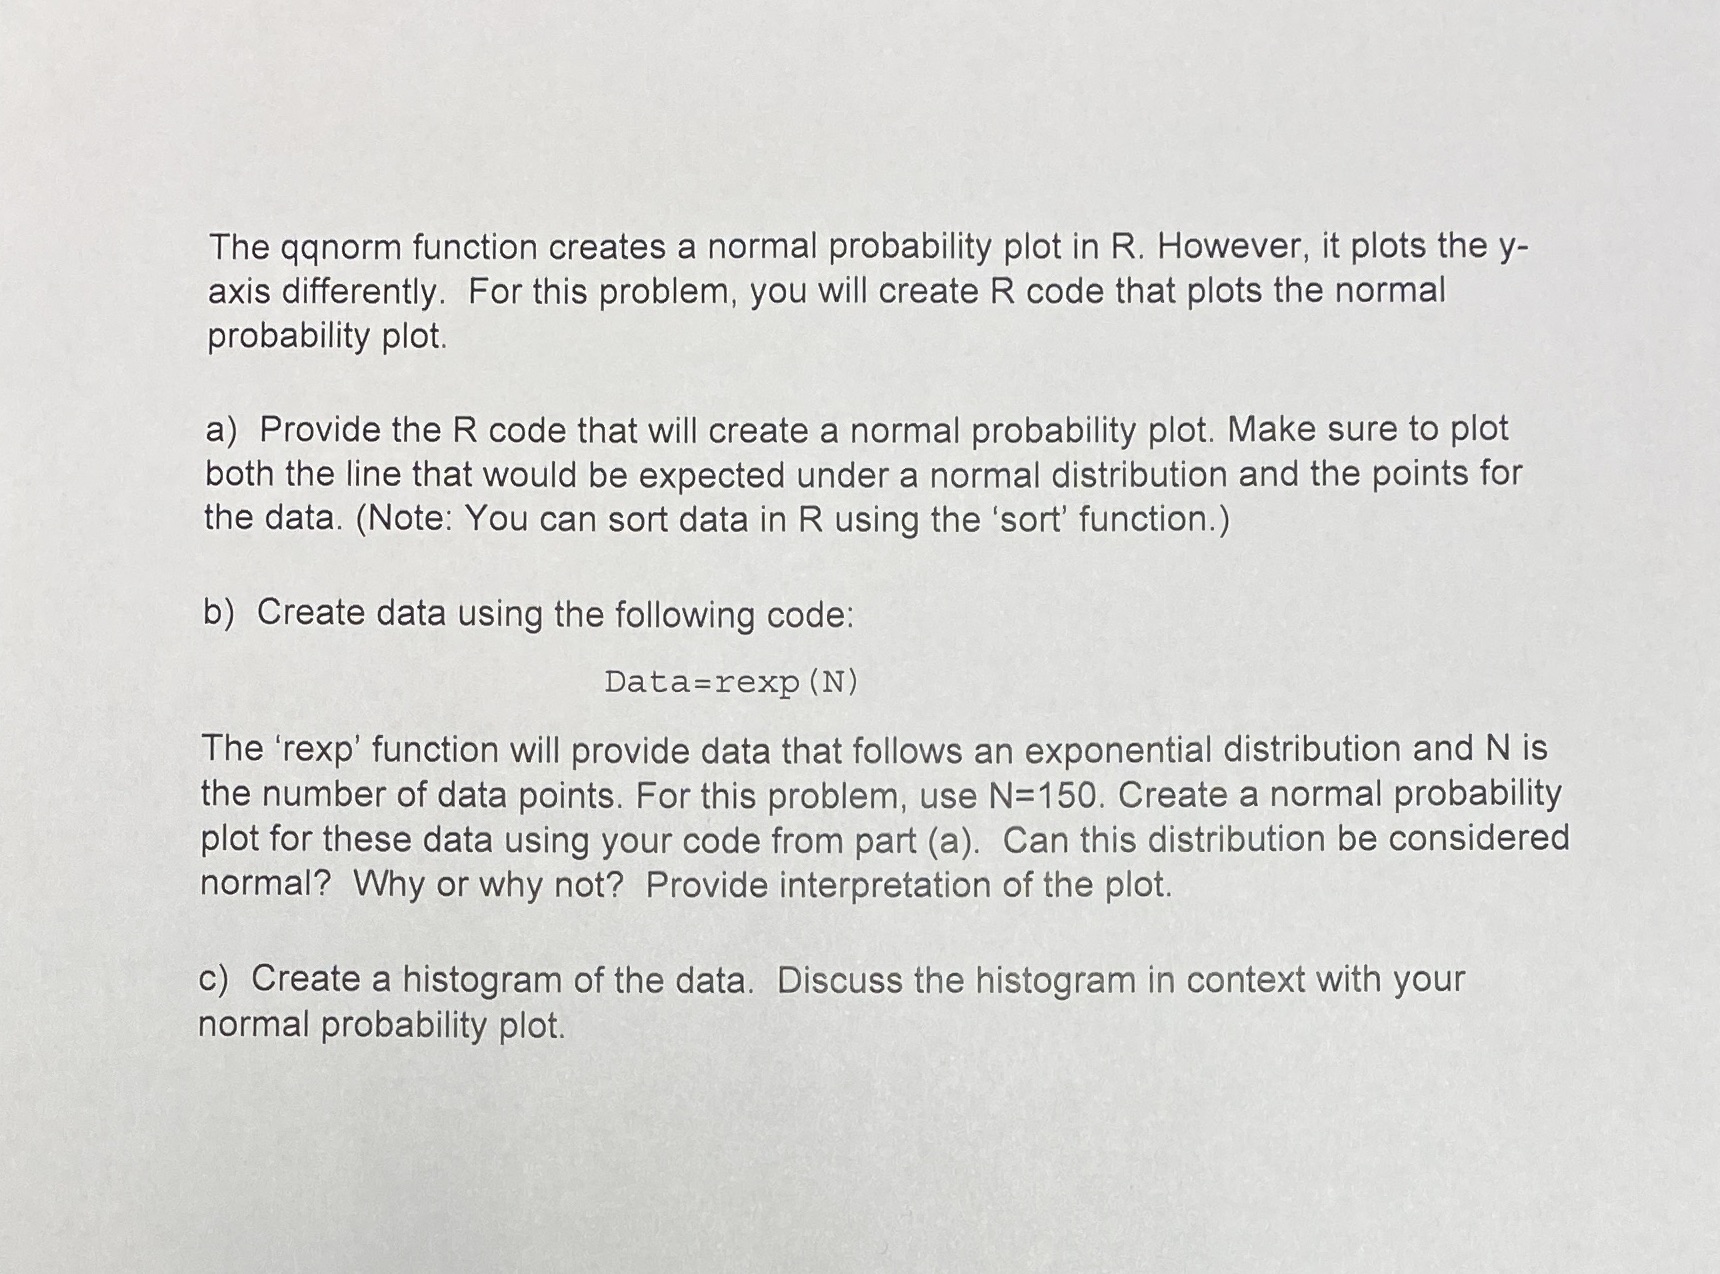
The qqnorm function creates a normal probability plot in R. However, it plots the y- axis differently. For this problem, you will create R code
Step by Step Solution
There are 3 Steps involved in it
Step: 1

Get Instant Access to Expert-Tailored Solutions
See step-by-step solutions with expert insights and AI powered tools for academic success
Step: 2

Step: 3
Ace Your Homework with AI
Get the answers you need in no time with our AI-driven, step-by-step assistance
Get Started
Advanced Calculus Of A Single Variable
Authors: Tunc Geveci
1st Edition
331927807X, 9783319278070