Answered step by step
Verified Expert Solution
Question
1 Approved Answer
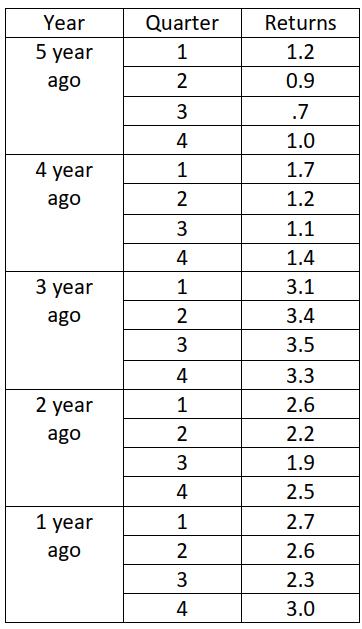
The quarterly data presented here show the number of appliances (in thousands) returned to a particular manufacturer for warranty service over the past five years.
The quarterly data presented here show the number of appliances (in thousands) returned to a particular manufacturer for warranty service over the past five years.

a. Develop an exponential smoothing forecast model, with alpha = 0.6 for the data. Forecast returns for each quarter of the current year.
b. Develop a linear trend line forecast for each of the four quarters and forecast returns for each quarter of the current year.
Which of the two approaches appear to be most accurate?
Year 5 year ago 4 year ago 3 year ago 2 year ago 1 year ago Quarter 1 2 3 412 3 4 1 23 2 3 4 1 2 3 4 1 2 3 4 Returns 1.2 0.9 .7 1.0 1.7 1.2 1.1 1.4 3.1 3.4 3.5 3.3 2.6 2.2 1.9 2.5 2.7 2.6 2.3 3.0
Step by Step Solution
★★★★★
3.41 Rating (151 Votes )
There are 3 Steps involved in it
Step: 1
Solution Here are the forecasts using exponential smoothing and linear trend models a Exponential sm...
Get Instant Access to Expert-Tailored Solutions
See step-by-step solutions with expert insights and AI powered tools for academic success
Step: 2

Step: 3

Ace Your Homework with AI
Get the answers you need in no time with our AI-driven, step-by-step assistance
Get Started


