

Question
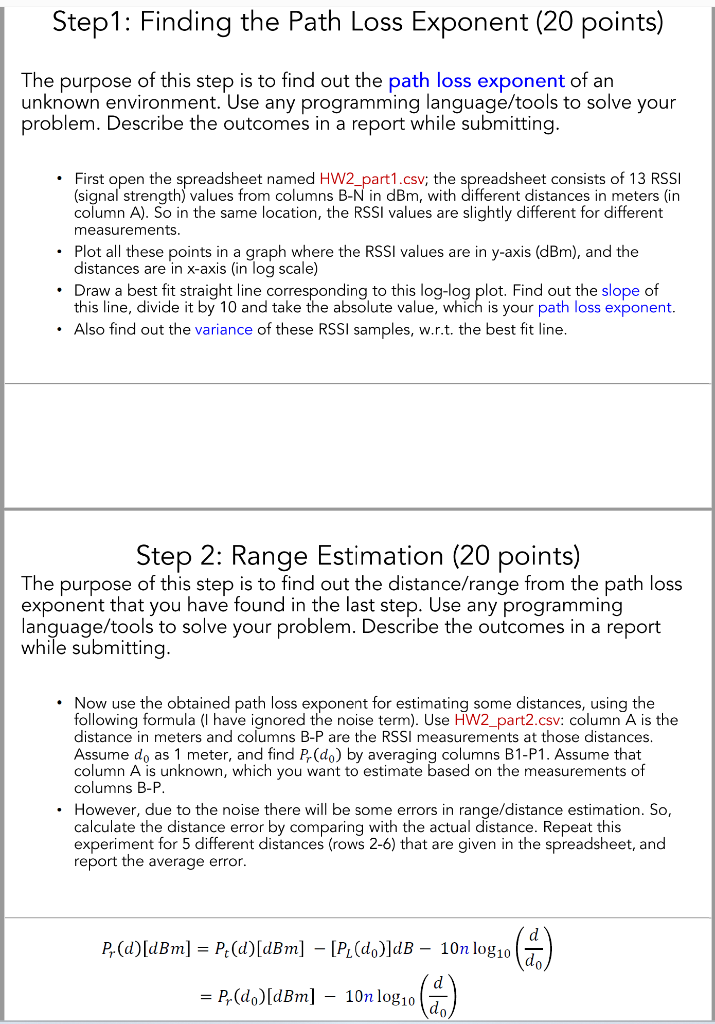
The question has 2 parts that needs to be solved (Step 1 and Step 2) as mentioned in the attached image. Its reference files are
The question has 2 parts that needs to be solved (Step 1 and Step 2) as mentioned in the attached image. Its reference files are also attached as image with the same name as mentioned in the question. Please mention what version of Python you are using, which IDE also. In case you need more details please let me know. Thank you! Please note I am asking this question again as the previous solution provided for this is not working for me, I am getting error and there is no way on this platform to reach out to the person who has given the python code. So, I would appreciate if you can mention all the details. Here the scatter log log needs to be done for x, y where they dont have same data size, I am getting error over there also.
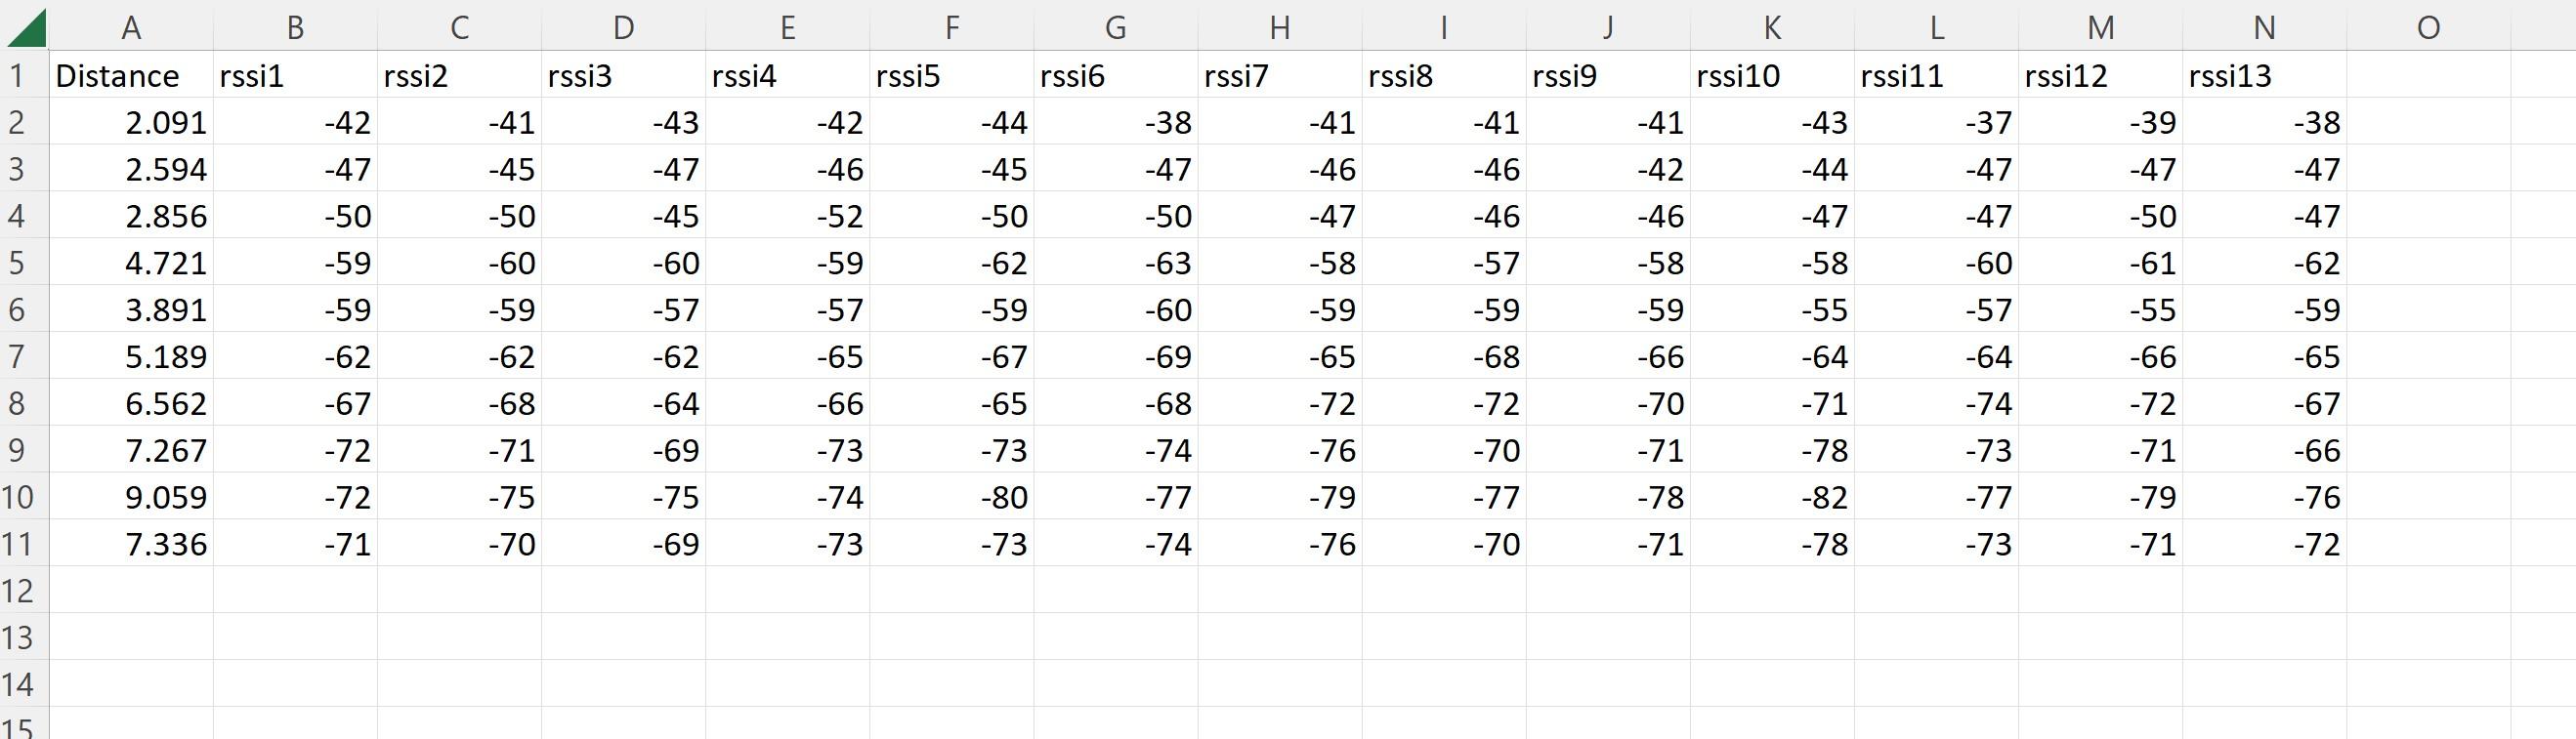
First data set for the file mentioned in Step 1
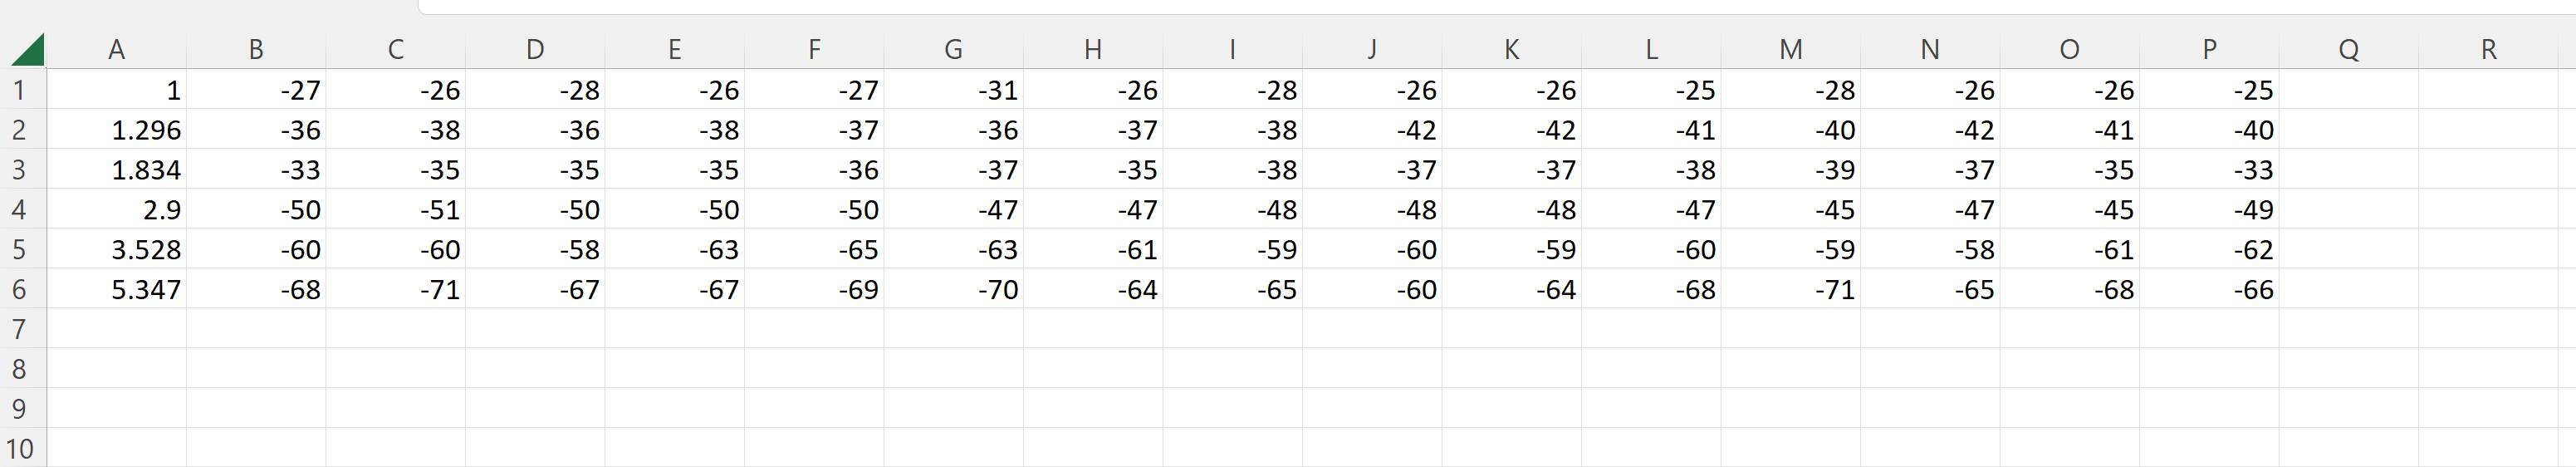
Second dataset as mentioned in the Step 2
Step by Step Solution
There are 3 Steps involved in it
Step: 1

Get Instant Access to Expert-Tailored Solutions
See step-by-step solutions with expert insights and AI powered tools for academic success
Step: 2

Step: 3
Ace Your Homework with AI
Get the answers you need in no time with our AI-driven, step-by-step assistance
Get Started
Database Systems Introduction To Databases And Data Warehouses
Authors: Nenad Jukic, Susan Vrbsky, Svetlozar Nestorov
1st Edition
1943153191, 978-1943153190