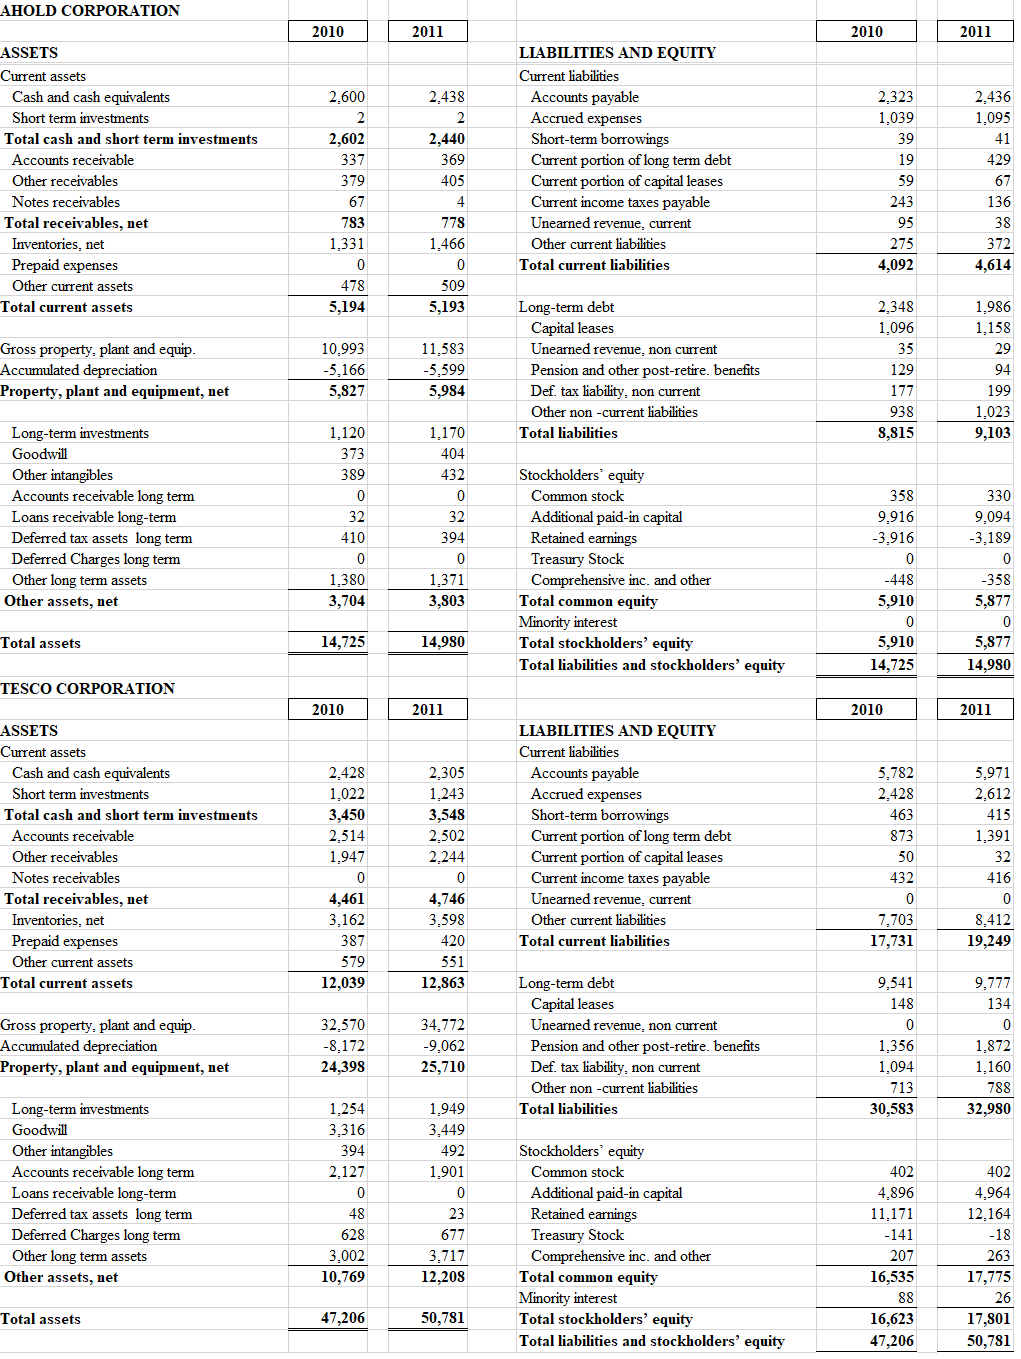
The questions that you are required to be addressed are as follows:a)Using the Dupont framework and ratio analysis technique, reformat the financial statements and analyze the performance of Tesco and Ahold.all the financial statements numbers are as below. balance sheet, income statement and cash flow statement for tesco and ahold corporation are attached respectively.
balance sheet
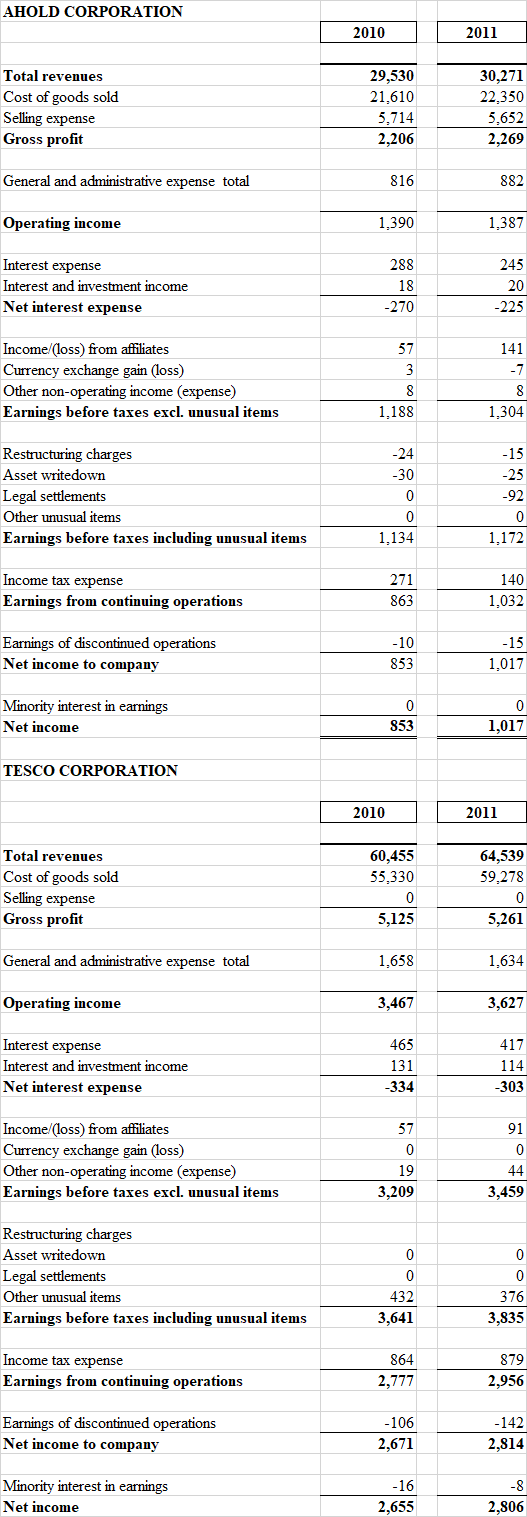
 income statement :
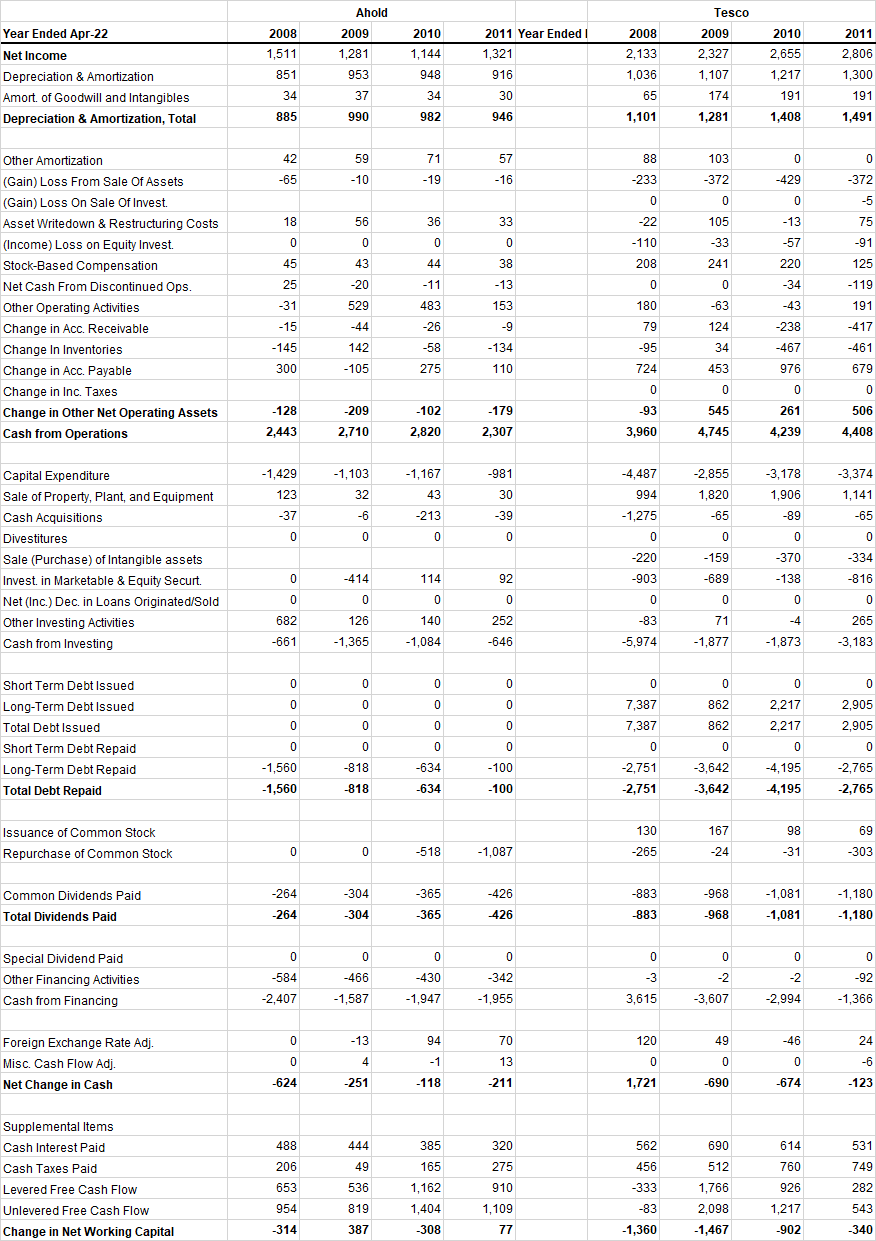
cash flow statement:
AHOLD CORPORATION 2010 2011 2010 2011 ASSETS Current assets Cash and cash equivalents Short term investments Total cash and short term investments Accounts receivable Other receivables Notes receivables Total receivables, net Inventories, net Prepaid expenses Other current assets Total current assets 2.600 2 2,602 337 379 67 783 1,331 2,438 2 2,440 369 405 4 778 1,466 0 509 5,193 LIABILITIES AND EQUITY Current liabilities Accounts payable Accrued expenses Short-term borrowings Current portion of long term debt Current portion of capital leases Current income taxes payable Unearned revenue, current Other current liabilities Total current liabilities 2.323 1,039 39 19 59 243 95 275 4,092 2.436 1,095 41 429 67 136 38 372 4,614 478 5,194 1.986 1,158 Gross property, plant and equip. Accumulated depreciation Property, plant and equipment, net 10.993 -5,166 11,583 -5,599 5,984 Long-term debt Capital leases Unearned revenue, non current Pension and other post-retire. benefits Def. tax liability, non current Other non-current liabilities Total liabilities 2.348 1,096 35 129 177 938 5,827 29 94 199 1,023 9,103 8,815 Long-term investments Goodwill Other intangibles Accounts receivable long term Loans receivable long-term Deferred tax assets long term Deferred Charges long term Other long term assets Other assets, net 1.120 373 389 0 32 410 0 1.380 3,704 1.170 404 432 0 32 394 0 1,371 3,803 Stockholders' equity Common stock Additional paid-in capital Retained earnings Treasury Stock Comprehensive inc. and other Total common equity Minority interest Total stockholders' equity Total liabilities and stockholders' equity 358 9,916 -3,916 0 -448 5,910 0 5,910 14,725 330 9,094 -3,189 0 -358 5,877 0 5,877 14,980 Total assets 14,725 14,980 TESCO CORPORATION 2010 2011 2010 2011 ASSETS Current assets Cash and cash equivalents Short term investments Total cash and short term investments Accounts receivable Other receivables Notes receivables Total receivables, net Inventories, net Prepaid expenses Other current assets Total current assets 2.428 1,022 3,450 2,514 1,947 0 4,461 3.162 387 579 12,039 2,305 1,243 3,548 2,502 2.244 0 4,746 3,598 420 551 12,863 LIABILITIES AND EQUITY Current liabilities Accounts payable Accrued expenses Short-term borrowings Current portion of long term debt Current portion of capital leases Current income taxes payable Unearned revenue, current Other current liabilities Total current liabilities 5.782 2,428 463 873 50 432 0 7,703 17,731 5.971 2.612 415 1,391 32 416 0 8,412 19,249 Gross property, plant and equip. Accumulated depreciation Property, plant and equipment, net 32,570 -8.172 24,398 34.772 -9,062 25,710 Long-term debt Capital leases Unearned revenue, non current Pension and other post-retire. benefits Def tax liability, non current Other non-current liabilities Total liabilities 9,541 148 0 1,356 1,094 713 30,583 9,777 134 0 1.872 1,160 788 32,980 Long-term investments Goodwill Other intangibles Accounts receivable long term Loans receivable long-term Deferred tax assets long term Deferred Charges long term Other long term assets Other assets, net 1.254 3,316 394 2.127 0 48 628 3,002 10,769 1.949 3.449 492 1,901 0 23 677 3.717 12,208 Stockholders' equity Common stock Additional paid-in capital Retained earnings Treasury Stock Comprehensive inc. and other Total common equity Minority interest Total stockholders' equity Total liabilities and stockholders' equity 402 4.896 11,171 -141 207 16,535 88 16,623 47,206 402 4,964 12.164 -18 263 17,775 26 17,801 50,781 Total assets 47,206 50,781 AHOLD CORPORATION 2010 2011 Total revenues Cost of goods sold Selling expense Gross profit 29,530 21,610 5,714 2,206 30,271 22,350 5,652 2,269 General and administrative expense total 816 882 Operating income 1,390 1,387 Interest expense Interest and investment income Net interest expense 288 18 -270 245 20 -225 57 Income/loss) from affiliates Currency exchange gain (loss) Other non-operating income (expense) Earnings before taxes excl. unusual items 3 8 1,188 141 -7 8 1,304 Restructuring charges Asset writedown Legal settlements Other unusual items Earnings before taxes including unusual items -24 -30 0 0 1.134 -15 -25 -92 0 1.172 Income tax expense Earnings from continuing operations 271 863 140 1,032 Earnings of discontinued operations Net income to company -10 853 -15 1,017 Minority interest in earnings Net income 0 853 0 1,017 TESCO CORPORATION 2010 2011 Total revenues Cost of goods sold Selling expense Gross profit 60,455 55,330 0 5,125 64,539 59.278 0 5,261 General and administrative expense total 1.658 1,634 Operating income 3,467 3,627 Interest expense Interest and investment income Net interest expense 465 131 -334 417 114 -303 57 0 Income (loss) from affiliates Currency exchange gain (loss) Other non-operating income (expense) Earnings before taxes excl. unusual items 91 0 44 3,459 19 3,209 0 Restructuring charges Asset writedown Legal settlements Other unusual items Earnings before taxes including unusual items 0 432 3,641 0 0 376 3,835 Income tax expense Earnings from continuing operations 864 2,777 879 2,956 Earnings of discontinued operations Net income to company -106 2,671 -142 2,814 Minority interest in earnings Net income -16 2,655 -8 2,806 Tesco Ahold 2009 1,281 2008 2011 2008 1,511 851 Year Ended Apr-22 Net Income Depreciation & Amortization Amort, of Goodwill and Intangibles Depreciation & Amortization, Total 2010 1,144 2011 Year Ended 1,321 916 2,133 1,036 2009 2,327 1,107 174 2010 2,655 1,217 2,806 1,300 953 948 34 37 34 30 65 191 191 1,491 885 990 982 946 1,101 1,281 1,408 42 59 71 57 88 103 0 0 -65 -10 -19 -16 -233 -372 -429 -372 0 0 0 -5 18 56 36 33 -22 105 -13 75 0 0 0 0 -33 -57 -91 -110 208 45 43 44 38 241 220 125 25 -20 -13 0 0 -34 -119 Other Amortization (Gain) Loss From Sale Of Assets (Gain) Loss On Sale Of Invest. Asset Write down & Restructuring Costs (Income) Loss on Equity Invest. Stock-Based Compensation Net Cash From Discontinued Ops. Other Operating Activities Change in Acc. Receivable Change In Inventories Change in Acc. Payable Change in Inc. Taxes Change in Other Net Operating Assets Cash from Operations -11 483 529 153 180 -63 -43 191 -31 -15 -44 -26 -9 79 124 -417 -145 142 -58 -134 -95 34 -238 -467 976 300 -105 275 110 724 453 -461 679 0 506 0 0 0 -179 545 -128 2,443 -209 2,710 -102 2,820 -93 3,960 261 4,239 2,307 4,745 4,408 - 1,103 -1,167 -981 -1,429 123 -2,855 1,820 -3,178 1,906 -4,487 994 -1,275 -3,374 1,141 32 43 30 -37 -6 -213 -39 -65 -89 -65 0 0 0 0 0 0 0 0 Capital Expenditure Sale of Property, Plant, and Equipment Cash Acquisitions Divestitures Sale (Purchase) of Intangible assets Invest. in Marketable & Equity Securt. Net (Inc.) Dec. in Loans Originated/Sold Other Investing Activities Cash from Investing -220 -159 -370 -334 -816 0 -414 92 -903 -138 -689 0 0 0 0 0 0 0 114 0 140 -1,084 682 252 -4 265 126 -1,365 -83 -5,974 71 -1,877 -661 -646 -1,873 -3,183 0 0 0 0 0 0 0 0 0 0 0 0 862 2,905 2,905 0 0 0 0 862 Short Term Debt Issued Long-Term Debt Issued Total Debt Issued Short Term Debt Repaid Long-Term Debt Repaid Total Debt Repaid 7,387 7,387 0 -2,751 0 0 0 0 0 0 2,217 2,217 0 -4,195 4,195 0 -818 -634 -100 -2,765 -1,560 -1,560 -3,642 -3,642 -818 -634 -100 -2,751 -2,765 130 167 98 69 Issuance of Common Stock Repurchase of Common Stock 0 0 -518 -1,087 -265 -24 -31 -303 -264 -304 -365 -426 -883 -968 Common Dividends Paid Total Dividends Paid -1,081 -1,081 -1,180 -1,180 -264 -304 -365 426 -883 -968 0 0 0 0 0 0 0 Special Dividend Paid Other Financing Activities Cash from Financing -584 -466 -430 0 -342 -1,955 -3 -2 -92 -2 -3,607 -2,407 -1,587 -1,947 3,615 -2,994 -1,366 0 -13 94 70 120 49 -46 24 Foreign Exchange Rate Adj. Misc. Cash Flow Adj. Net Change in Cash 0 0 4 -1 13 0 0 0 -6 -624 -251 -118 -211 1,721 -690 -674 -123 488 444 385 562 690 614 531 749 206 49 456 760 Supplemental Items Cash Interest Paid Cash Taxes Paid Levered Free Cash Flow Unlevered Free Cash Flow Change in Net Working Capital 320 275 910 1,109 653 165 1,162 1,404 536 -333 926 512 1,766 2,098 -1,467 282 543 954 819 -83 -1,360 1,217 -902 -314 387 -308 77 -340 AHOLD CORPORATION 2010 2011 2010 2011 ASSETS Current assets Cash and cash equivalents Short term investments Total cash and short term investments Accounts receivable Other receivables Notes receivables Total receivables, net Inventories, net Prepaid expenses Other current assets Total current assets 2.600 2 2,602 337 379 67 783 1,331 2,438 2 2,440 369 405 4 778 1,466 0 509 5,193 LIABILITIES AND EQUITY Current liabilities Accounts payable Accrued expenses Short-term borrowings Current portion of long term debt Current portion of capital leases Current income taxes payable Unearned revenue, current Other current liabilities Total current liabilities 2.323 1,039 39 19 59 243 95 275 4,092 2.436 1,095 41 429 67 136 38 372 4,614 478 5,194 1.986 1,158 Gross property, plant and equip. Accumulated depreciation Property, plant and equipment, net 10.993 -5,166 11,583 -5,599 5,984 Long-term debt Capital leases Unearned revenue, non current Pension and other post-retire. benefits Def. tax liability, non current Other non-current liabilities Total liabilities 2.348 1,096 35 129 177 938 5,827 29 94 199 1,023 9,103 8,815 Long-term investments Goodwill Other intangibles Accounts receivable long term Loans receivable long-term Deferred tax assets long term Deferred Charges long term Other long term assets Other assets, net 1.120 373 389 0 32 410 0 1.380 3,704 1.170 404 432 0 32 394 0 1,371 3,803 Stockholders' equity Common stock Additional paid-in capital Retained earnings Treasury Stock Comprehensive inc. and other Total common equity Minority interest Total stockholders' equity Total liabilities and stockholders' equity 358 9,916 -3,916 0 -448 5,910 0 5,910 14,725 330 9,094 -3,189 0 -358 5,877 0 5,877 14,980 Total assets 14,725 14,980 TESCO CORPORATION 2010 2011 2010 2011 ASSETS Current assets Cash and cash equivalents Short term investments Total cash and short term investments Accounts receivable Other receivables Notes receivables Total receivables, net Inventories, net Prepaid expenses Other current assets Total current assets 2.428 1,022 3,450 2,514 1,947 0 4,461 3.162 387 579 12,039 2,305 1,243 3,548 2,502 2.244 0 4,746 3,598 420 551 12,863 LIABILITIES AND EQUITY Current liabilities Accounts payable Accrued expenses Short-term borrowings Current portion of long term debt Current portion of capital leases Current income taxes payable Unearned revenue, current Other current liabilities Total current liabilities 5.782 2,428 463 873 50 432 0 7,703 17,731 5.971 2.612 415 1,391 32 416 0 8,412 19,249 Gross property, plant and equip. Accumulated depreciation Property, plant and equipment, net 32,570 -8.172 24,398 34.772 -9,062 25,710 Long-term debt Capital leases Unearned revenue, non current Pension and other post-retire. benefits Def tax liability, non current Other non-current liabilities Total liabilities 9,541 148 0 1,356 1,094 713 30,583 9,777 134 0 1.872 1,160 788 32,980 Long-term investments Goodwill Other intangibles Accounts receivable long term Loans receivable long-term Deferred tax assets long term Deferred Charges long term Other long term assets Other assets, net 1.254 3,316 394 2.127 0 48 628 3,002 10,769 1.949 3.449 492 1,901 0 23 677 3.717 12,208 Stockholders' equity Common stock Additional paid-in capital Retained earnings Treasury Stock Comprehensive inc. and other Total common equity Minority interest Total stockholders' equity Total liabilities and stockholders' equity 402 4.896 11,171 -141 207 16,535 88 16,623 47,206 402 4,964 12.164 -18 263 17,775 26 17,801 50,781 Total assets 47,206 50,781 AHOLD CORPORATION 2010 2011 Total revenues Cost of goods sold Selling expense Gross profit 29,530 21,610 5,714 2,206 30,271 22,350 5,652 2,269 General and administrative expense total 816 882 Operating income 1,390 1,387 Interest expense Interest and investment income Net interest expense 288 18 -270 245 20 -225 57 Income/loss) from affiliates Currency exchange gain (loss) Other non-operating income (expense) Earnings before taxes excl. unusual items 3 8 1,188 141 -7 8 1,304 Restructuring charges Asset writedown Legal settlements Other unusual items Earnings before taxes including unusual items -24 -30 0 0 1.134 -15 -25 -92 0 1.172 Income tax expense Earnings from continuing operations 271 863 140 1,032 Earnings of discontinued operations Net income to company -10 853 -15 1,017 Minority interest in earnings Net income 0 853 0 1,017 TESCO CORPORATION 2010 2011 Total revenues Cost of goods sold Selling expense Gross profit 60,455 55,330 0 5,125 64,539 59.278 0 5,261 General and administrative expense total 1.658 1,634 Operating income 3,467 3,627 Interest expense Interest and investment income Net interest expense 465 131 -334 417 114 -303 57 0 Income (loss) from affiliates Currency exchange gain (loss) Other non-operating income (expense) Earnings before taxes excl. unusual items 91 0 44 3,459 19 3,209 0 Restructuring charges Asset writedown Legal settlements Other unusual items Earnings before taxes including unusual items 0 432 3,641 0 0 376 3,835 Income tax expense Earnings from continuing operations 864 2,777 879 2,956 Earnings of discontinued operations Net income to company -106 2,671 -142 2,814 Minority interest in earnings Net income -16 2,655 -8 2,806 Tesco Ahold 2009 1,281 2008 2011 2008 1,511 851 Year Ended Apr-22 Net Income Depreciation & Amortization Amort, of Goodwill and Intangibles Depreciation & Amortization, Total 2010 1,144 2011 Year Ended 1,321 916 2,133 1,036 2009 2,327 1,107 174 2010 2,655 1,217 2,806 1,300 953 948 34 37 34 30 65 191 191 1,491 885 990 982 946 1,101 1,281 1,408 42 59 71 57 88 103 0 0 -65 -10 -19 -16 -233 -372 -429 -372 0 0 0 -5 18 56 36 33 -22 105 -13 75 0 0 0 0 -33 -57 -91 -110 208 45 43 44 38 241 220 125 25 -20 -13 0 0 -34 -119 Other Amortization (Gain) Loss From Sale Of Assets (Gain) Loss On Sale Of Invest. Asset Write down & Restructuring Costs (Income) Loss on Equity Invest. Stock-Based Compensation Net Cash From Discontinued Ops. Other Operating Activities Change in Acc. Receivable Change In Inventories Change in Acc. Payable Change in Inc. Taxes Change in Other Net Operating Assets Cash from Operations -11 483 529 153 180 -63 -43 191 -31 -15 -44 -26 -9 79 124 -417 -145 142 -58 -134 -95 34 -238 -467 976 300 -105 275 110 724 453 -461 679 0 506 0 0 0 -179 545 -128 2,443 -209 2,710 -102 2,820 -93 3,960 261 4,239 2,307 4,745 4,408 - 1,103 -1,167 -981 -1,429 123 -2,855 1,820 -3,178 1,906 -4,487 994 -1,275 -3,374 1,141 32 43 30 -37 -6 -213 -39 -65 -89 -65 0 0 0 0 0 0 0 0 Capital Expenditure Sale of Property, Plant, and Equipment Cash Acquisitions Divestitures Sale (Purchase) of Intangible assets Invest. in Marketable & Equity Securt. Net (Inc.) Dec. in Loans Originated/Sold Other Investing Activities Cash from Investing -220 -159 -370 -334 -816 0 -414 92 -903 -138 -689 0 0 0 0 0 0 0 114 0 140 -1,084 682 252 -4 265 126 -1,365 -83 -5,974 71 -1,877 -661 -646 -1,873 -3,183 0 0 0 0 0 0 0 0 0 0 0 0 862 2,905 2,905 0 0 0 0 862 Short Term Debt Issued Long-Term Debt Issued Total Debt Issued Short Term Debt Repaid Long-Term Debt Repaid Total Debt Repaid 7,387 7,387 0 -2,751 0 0 0 0 0 0 2,217 2,217 0 -4,195 4,195 0 -818 -634 -100 -2,765 -1,560 -1,560 -3,642 -3,642 -818 -634 -100 -2,751 -2,765 130 167 98 69 Issuance of Common Stock Repurchase of Common Stock 0 0 -518 -1,087 -265 -24 -31 -303 -264 -304 -365 -426 -883 -968 Common Dividends Paid Total Dividends Paid -1,081 -1,081 -1,180 -1,180 -264 -304 -365 426 -883 -968 0 0 0 0 0 0 0 Special Dividend Paid Other Financing Activities Cash from Financing -584 -466 -430 0 -342 -1,955 -3 -2 -92 -2 -3,607 -2,407 -1,587 -1,947 3,615 -2,994 -1,366 0 -13 94 70 120 49 -46 24 Foreign Exchange Rate Adj. Misc. Cash Flow Adj. Net Change in Cash 0 0 4 -1 13 0 0 0 -6 -624 -251 -118 -211 1,721 -690 -674 -123 488 444 385 562 690 614 531 749 206 49 456 760 Supplemental Items Cash Interest Paid Cash Taxes Paid Levered Free Cash Flow Unlevered Free Cash Flow Change in Net Working Capital 320 275 910 1,109 653 165 1,162 1,404 536 -333 926 512 1,766 2,098 -1,467 282 543 954 819 -83 -1,360 1,217 -902 -314 387 -308 77 -340