the qustions from1-6 need to be answers there is a small red dash next to them those are the one, and they need to be done at excal sheet
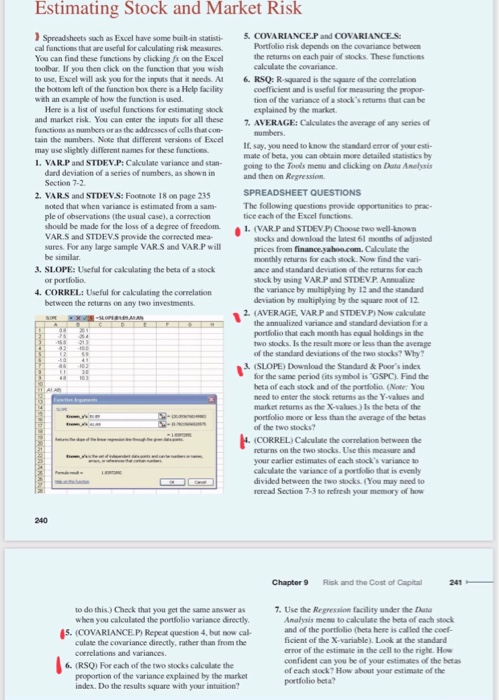
Estimating Stock and Market Risk Spreadsheets sach as Excel have some built-in statisti- cal functions that are useful for calculating risk measares. You can find these functions by clicking fx on the Excel toolbar. If you then click on the function that you wish to use, Excel will ask you for the inputs that it needs. At the bottom left of the function box there is a Help facility wth an example of how the function is used. Here is a list of useful functions for estimating stock and market risk. You can enter the inputs for all these 5. COVARIANCE.P and COVARIANCES Portfolio risk depends on the covariance between the returns on each pair of stocks. These functicns calculate the covariance. 6. RSQ: R-squared is the square of the corelaticn coefficient and is useful for measuring the peopor- tion of the variance of a stock's returns that can be explained by the market. 7. AVERAGE: Calculates the average of any series of numbers If say. you need to know the standard error of your esti- mate of beta, you can obtain more detailed statistics by going to the Tools menu and clicking on Data Anelysis and then on Regression. functions as numbers or as the addresses of eells that con- tain the numbers. Note that different versions of Excel may use slightly different names for these functicns. 1. VARP and STDEV.P: Calculate variance and stan- dard deviation of a series of numbers, as shown in Section 7-2 2. VARS and STDEVS: Footnote 18 on page 235 oted that when variance is estimated from a sam- ple of observations (the usual case), a correction should be made for the loss of a degree of freedom VAR.S and STDEVS provide the corrected mea- sures. For any large sample VAR.S and VAR.P will SPREADSHEET QUESTIONS The following questions provide opportunities to prac- tice each of the Excel functions 1. (VARP and STDEV P) Choose two well-known stocks and download the latest 61 months of adjasted prices from finance.yahoa.com. Calculate the monthly returas for cach stock. Now find the vari- ance and standard deviation of the returns for each be similar 3. SLOPE: Useful for calculating the beta of a stock or portfolio. 4. CORREL: Useful for cakculating the correlation between the returns on any two investments slock by using VARP and STDEVP. Annualize the variance by multiplying by 12 and the standard deviation by multiplying by the square root of 12 2. (AVERAGE, VARP and STDEVP) Now cakculate xVI-OPamA the annualized variance and standard deviation for a A portfolio that cach moath has equal holdings in the two stocks. Is the result more or less than the average of the standard deviations of the two stocks? Why? 21 12 41 3. (SLOPE) Download the Standard & Poor's index for the same period (its symbol is "GSPC). Find the beta of each stock and of the portfolio. (Note You need to enter the stock returns as the Y-values and 103 tALA 121 14 market returns as the X-values.) Is the beta of the portfolio more or less than the average of the betas of the two stocks? (CORREL) Calculate the correlation between the returns on the two stocks. Use this measure and your earlier estimates of each stock's variance to calculate the variance of a portfolio that is evenly divided between the two stocks. (You may need to reread Section 7-3 to refresh your memory of how 240 Chapter 9 Risk and the Cost of Capital 241 to do this.) Check that you get the same ans wer as when you calculated the portfolio variance directly. 5. (COVARIANCE P) Repeat question 4, but now cal- culate the covariance directly, rather than from the 7. Use the Regression facility under the Data Analysis menu to calculate the beta of each stock and of the portfolio (beta here is called the coef- ficient of the X-variable). Look at the standard error of the estimate in the cell to the right. How correlations and variances. confident can you be of your estimates of the betas of each stock? How about your estimate of the portfolio beta? 6. (RSQ) For each of the two stocks calculate the proportion of the variance explained by the market index. Do the results square with your intuition? Estimating Stock and Market Risk Spreadsheets sach as Excel have some built-in statisti- cal functions that are useful for calculating risk measares. You can find these functions by clicking fx on the Excel toolbar. If you then click on the function that you wish to use, Excel will ask you for the inputs that it needs. At the bottom left of the function box there is a Help facility wth an example of how the function is used. Here is a list of useful functions for estimating stock and market risk. You can enter the inputs for all these 5. COVARIANCE.P and COVARIANCES Portfolio risk depends on the covariance between the returns on each pair of stocks. These functicns calculate the covariance. 6. RSQ: R-squared is the square of the corelaticn coefficient and is useful for measuring the peopor- tion of the variance of a stock's returns that can be explained by the market. 7. AVERAGE: Calculates the average of any series of numbers If say. you need to know the standard error of your esti- mate of beta, you can obtain more detailed statistics by going to the Tools menu and clicking on Data Anelysis and then on Regression. functions as numbers or as the addresses of eells that con- tain the numbers. Note that different versions of Excel may use slightly different names for these functicns. 1. VARP and STDEV.P: Calculate variance and stan- dard deviation of a series of numbers, as shown in Section 7-2 2. VARS and STDEVS: Footnote 18 on page 235 oted that when variance is estimated from a sam- ple of observations (the usual case), a correction should be made for the loss of a degree of freedom VAR.S and STDEVS provide the corrected mea- sures. For any large sample VAR.S and VAR.P will SPREADSHEET QUESTIONS The following questions provide opportunities to prac- tice each of the Excel functions 1. (VARP and STDEV P) Choose two well-known stocks and download the latest 61 months of adjasted prices from finance.yahoa.com. Calculate the monthly returas for cach stock. Now find the vari- ance and standard deviation of the returns for each be similar 3. SLOPE: Useful for calculating the beta of a stock or portfolio. 4. CORREL: Useful for cakculating the correlation between the returns on any two investments slock by using VARP and STDEVP. Annualize the variance by multiplying by 12 and the standard deviation by multiplying by the square root of 12 2. (AVERAGE, VARP and STDEVP) Now cakculate xVI-OPamA the annualized variance and standard deviation for a A portfolio that cach moath has equal holdings in the two stocks. Is the result more or less than the average of the standard deviations of the two stocks? Why? 21 12 41 3. (SLOPE) Download the Standard & Poor's index for the same period (its symbol is "GSPC). Find the beta of each stock and of the portfolio. (Note You need to enter the stock returns as the Y-values and 103 tALA 121 14 market returns as the X-values.) Is the beta of the portfolio more or less than the average of the betas of the two stocks? (CORREL) Calculate the correlation between the returns on the two stocks. Use this measure and your earlier estimates of each stock's variance to calculate the variance of a portfolio that is evenly divided between the two stocks. (You may need to reread Section 7-3 to refresh your memory of how 240 Chapter 9 Risk and the Cost of Capital 241 to do this.) Check that you get the same ans wer as when you calculated the portfolio variance directly. 5. (COVARIANCE P) Repeat question 4, but now cal- culate the covariance directly, rather than from the 7. Use the Regression facility under the Data Analysis menu to calculate the beta of each stock and of the portfolio (beta here is called the coef- ficient of the X-variable). Look at the standard error of the estimate in the cell to the right. How correlations and variances. confident can you be of your estimates of the betas of each stock? How about your estimate of the portfolio beta? 6. (RSQ) For each of the two stocks calculate the proportion of the variance explained by the market index. Do the results square with your intuition