Answered step by step
Verified Expert Solution
Question
1 Approved Answer
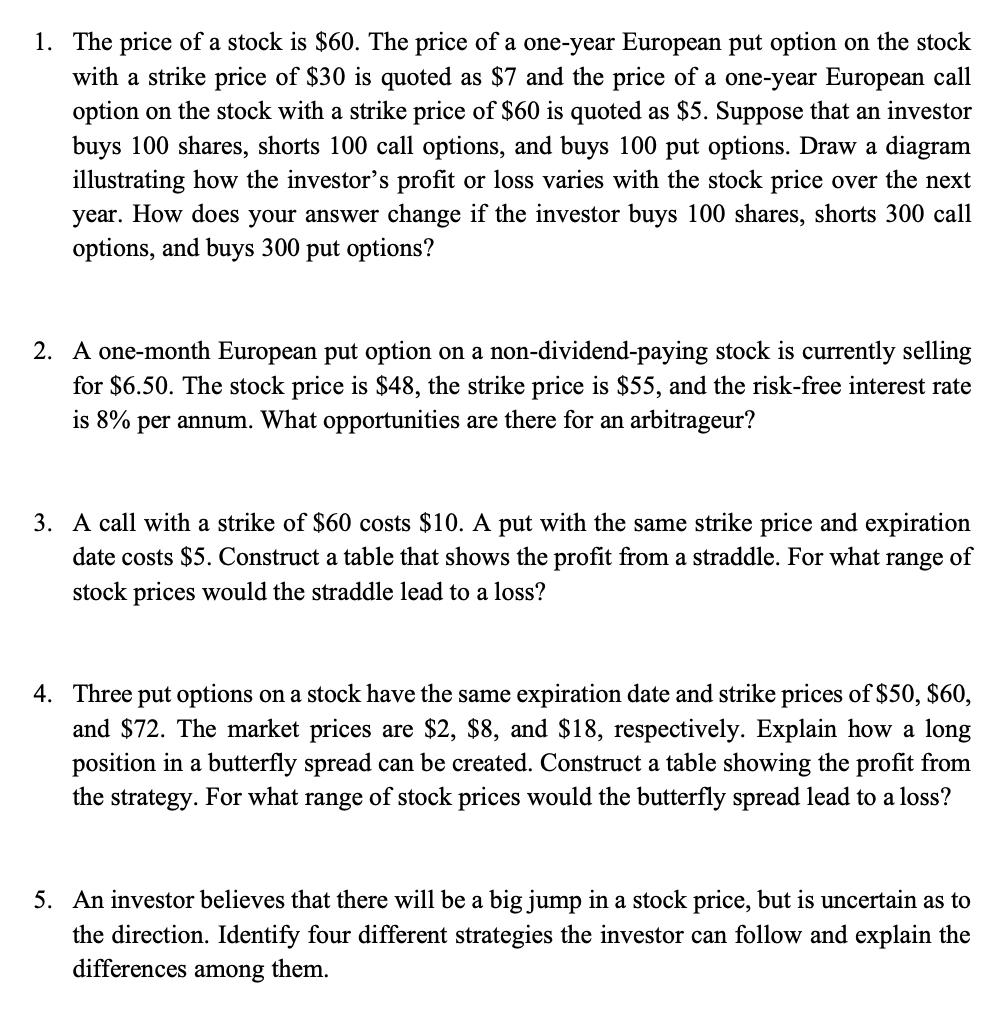
1. The price of a stock is $60. The price of a one-year European put option on the stock with a strike price of

1. The price of a stock is $60. The price of a one-year European put option on the stock with a strike price of $30 is quoted as $7 and the price of a one-year European call option on the stock with a strike price of $60 is quoted as $5. Suppose that an investor buys 100 shares, shorts 100 call options, and buys 100 put options. Draw a diagram illustrating how the investor's profit or loss varies with the stock price over the next year. How does your answer change if the investor buys 100 shares, shorts 300 call options, and buys 300 put options? 2. A one-month European put option on a non-dividend-paying stock is currently selling for $6.50. The stock price is $48, the strike price is $55, and the risk-free interest rate is 8% per annum. What opportunities are there for an arbitrageur? 3. A call with a strike of $60 costs $10. A put with the same strike price and expiration date costs $5. Construct a table that shows the profit from a straddle. For what range of stock prices would the straddle lead to a loss? 4. Three put options on a stock have the same expiration date and strike prices of $50, $60, and $72. The market prices are $2, $8, and $18, respectively. Explain how a long position in a butterfly spread can be created. Construct a table showing the profit from the strategy. For what range of stock prices would the butterfly spread lead to a loss? 5. An investor believes that there will be a big jump in a stock price, but is uncertain as to the direction. Identify four different strategies the investor can follow and explain the differences among them.
Step by Step Solution
★★★★★
3.39 Rating (158 Votes )
There are 3 Steps involved in it
Step: 1
1 If the investor buys 100 shares shorts 100 call options and buys 100 put options the resulting diagram illustrating the investors profit or loss with the stock price over the next year would look li...
Get Instant Access to Expert-Tailored Solutions
See step-by-step solutions with expert insights and AI powered tools for academic success
Step: 2

Step: 3

Ace Your Homework with AI
Get the answers you need in no time with our AI-driven, step-by-step assistance
Get Started


