Answered step by step
Verified Expert Solution
Question
1 Approved Answer
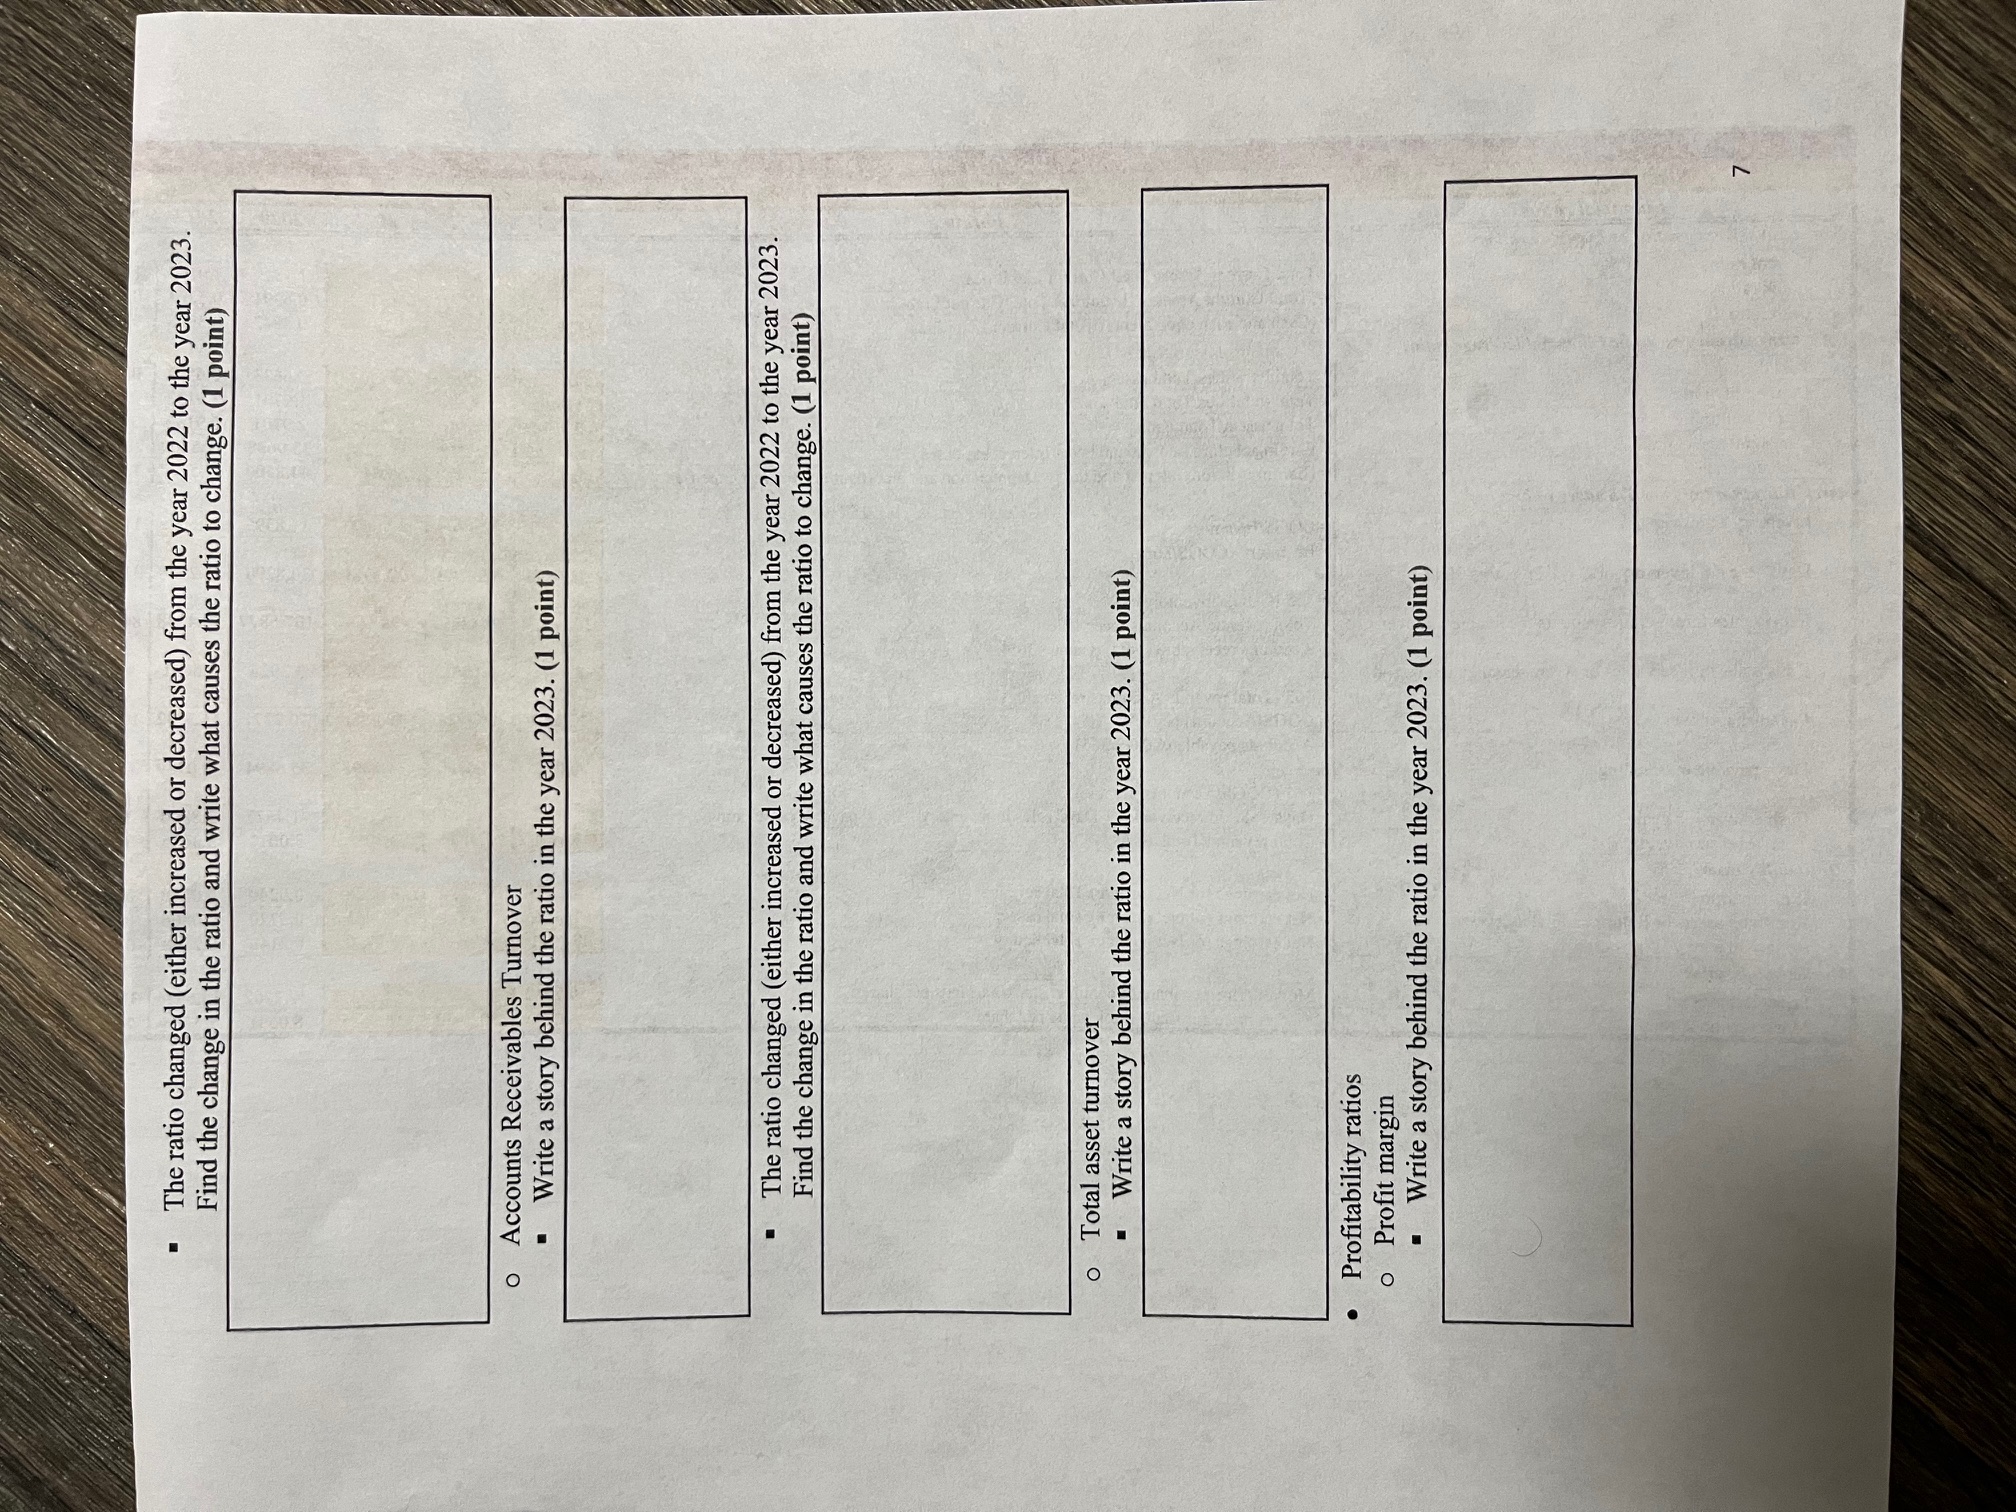
The ratio changed (either increased or decreased) from the year 2022 to the year 2023. Find the change in the ratio and write what


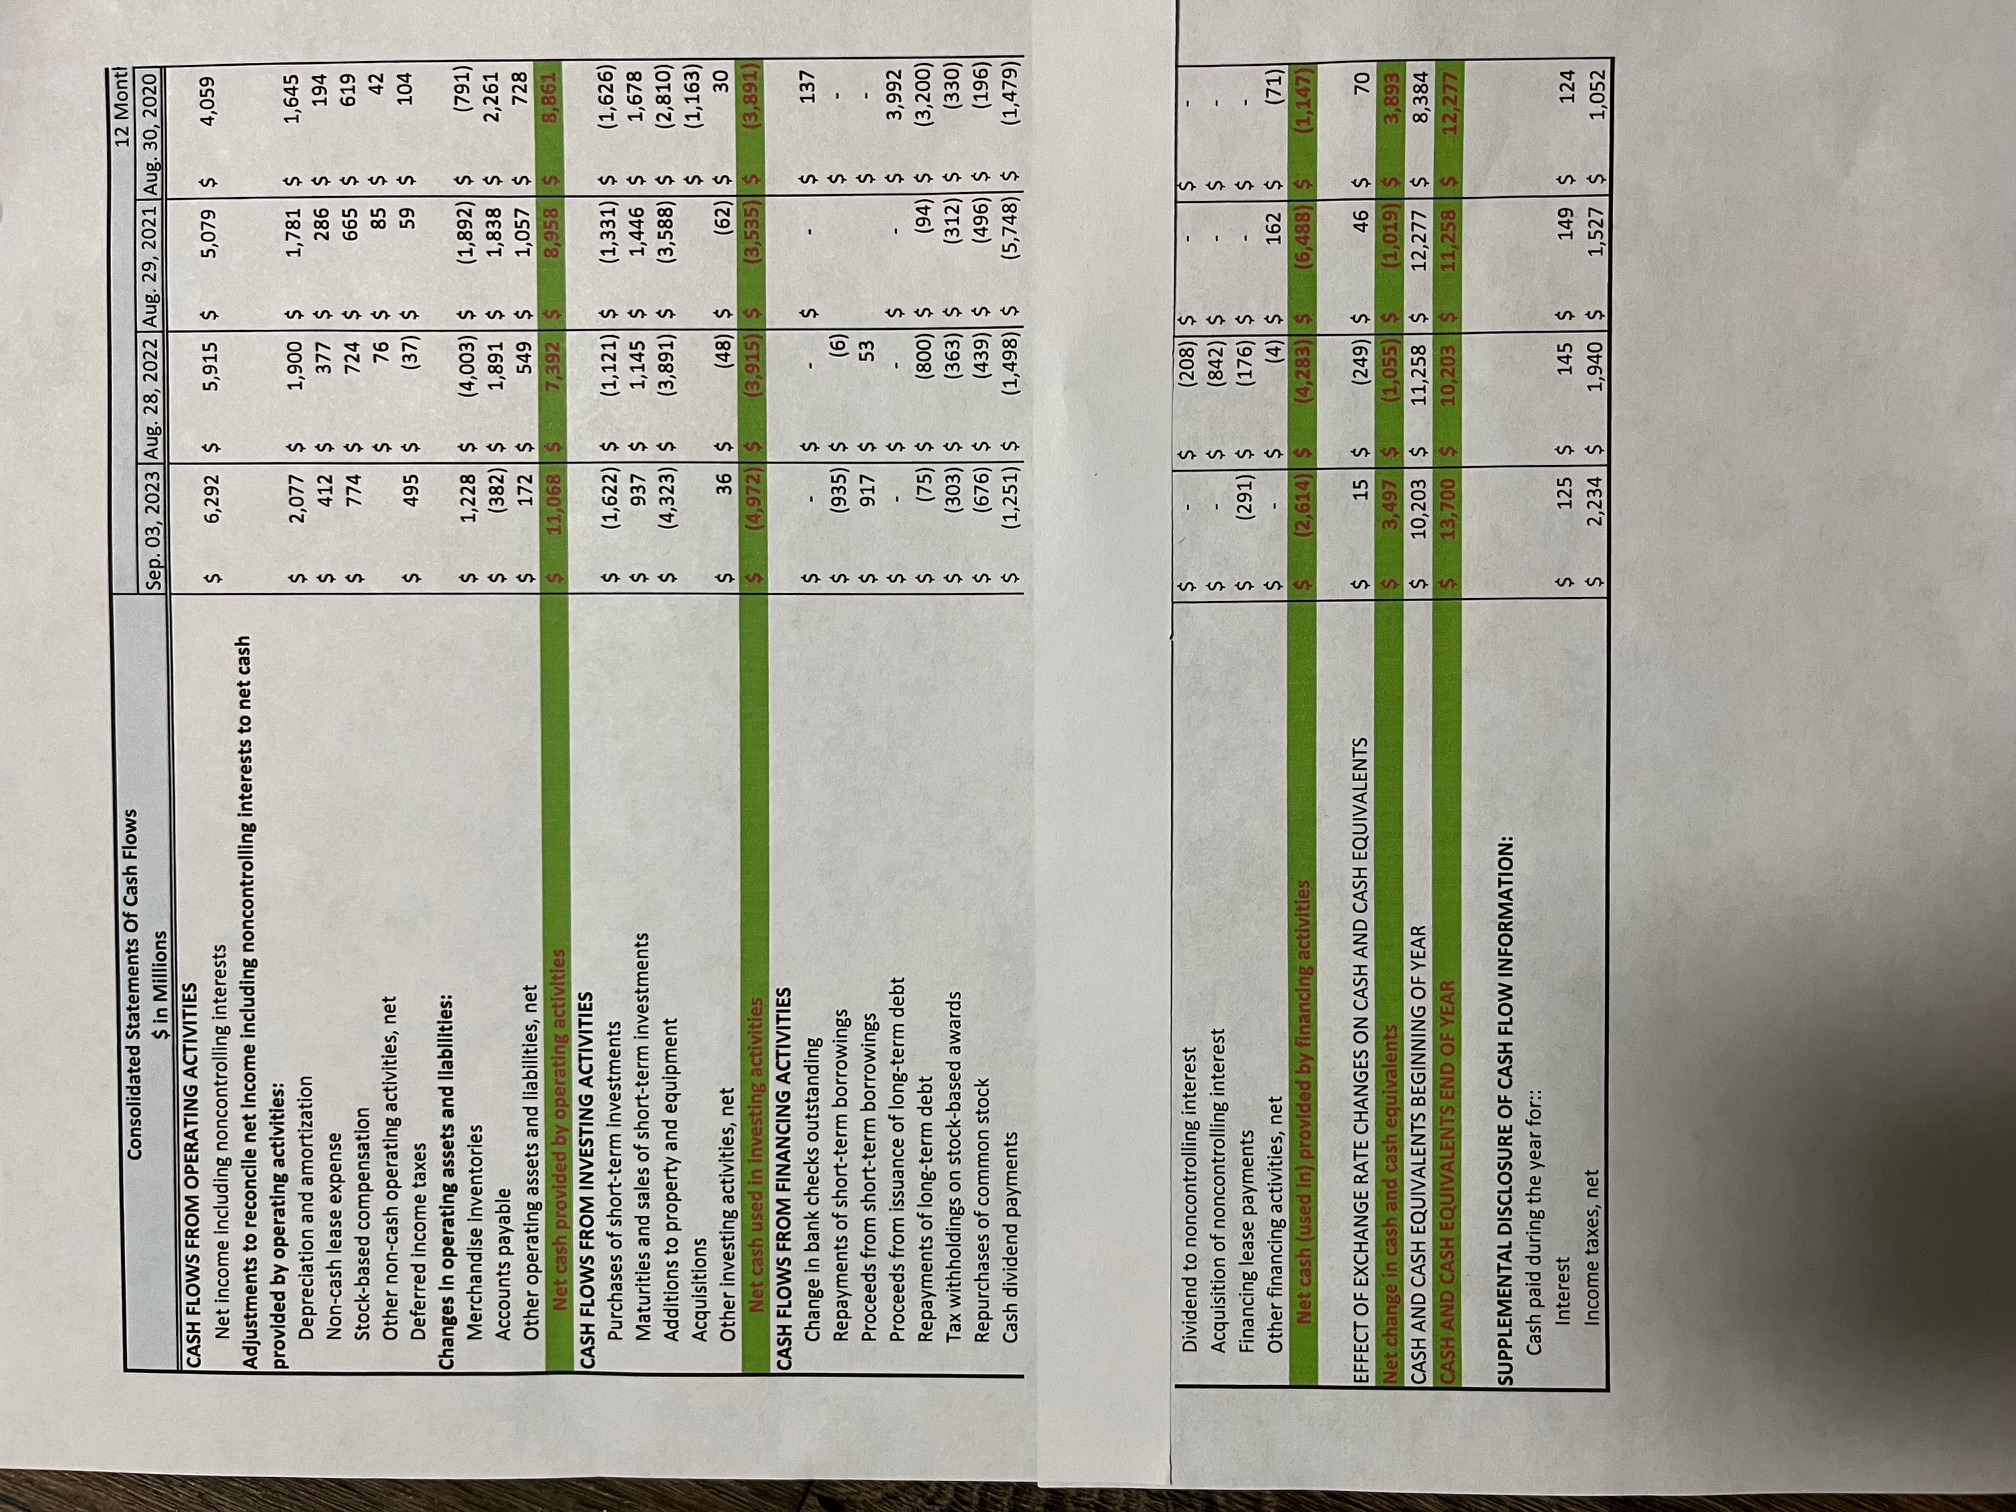
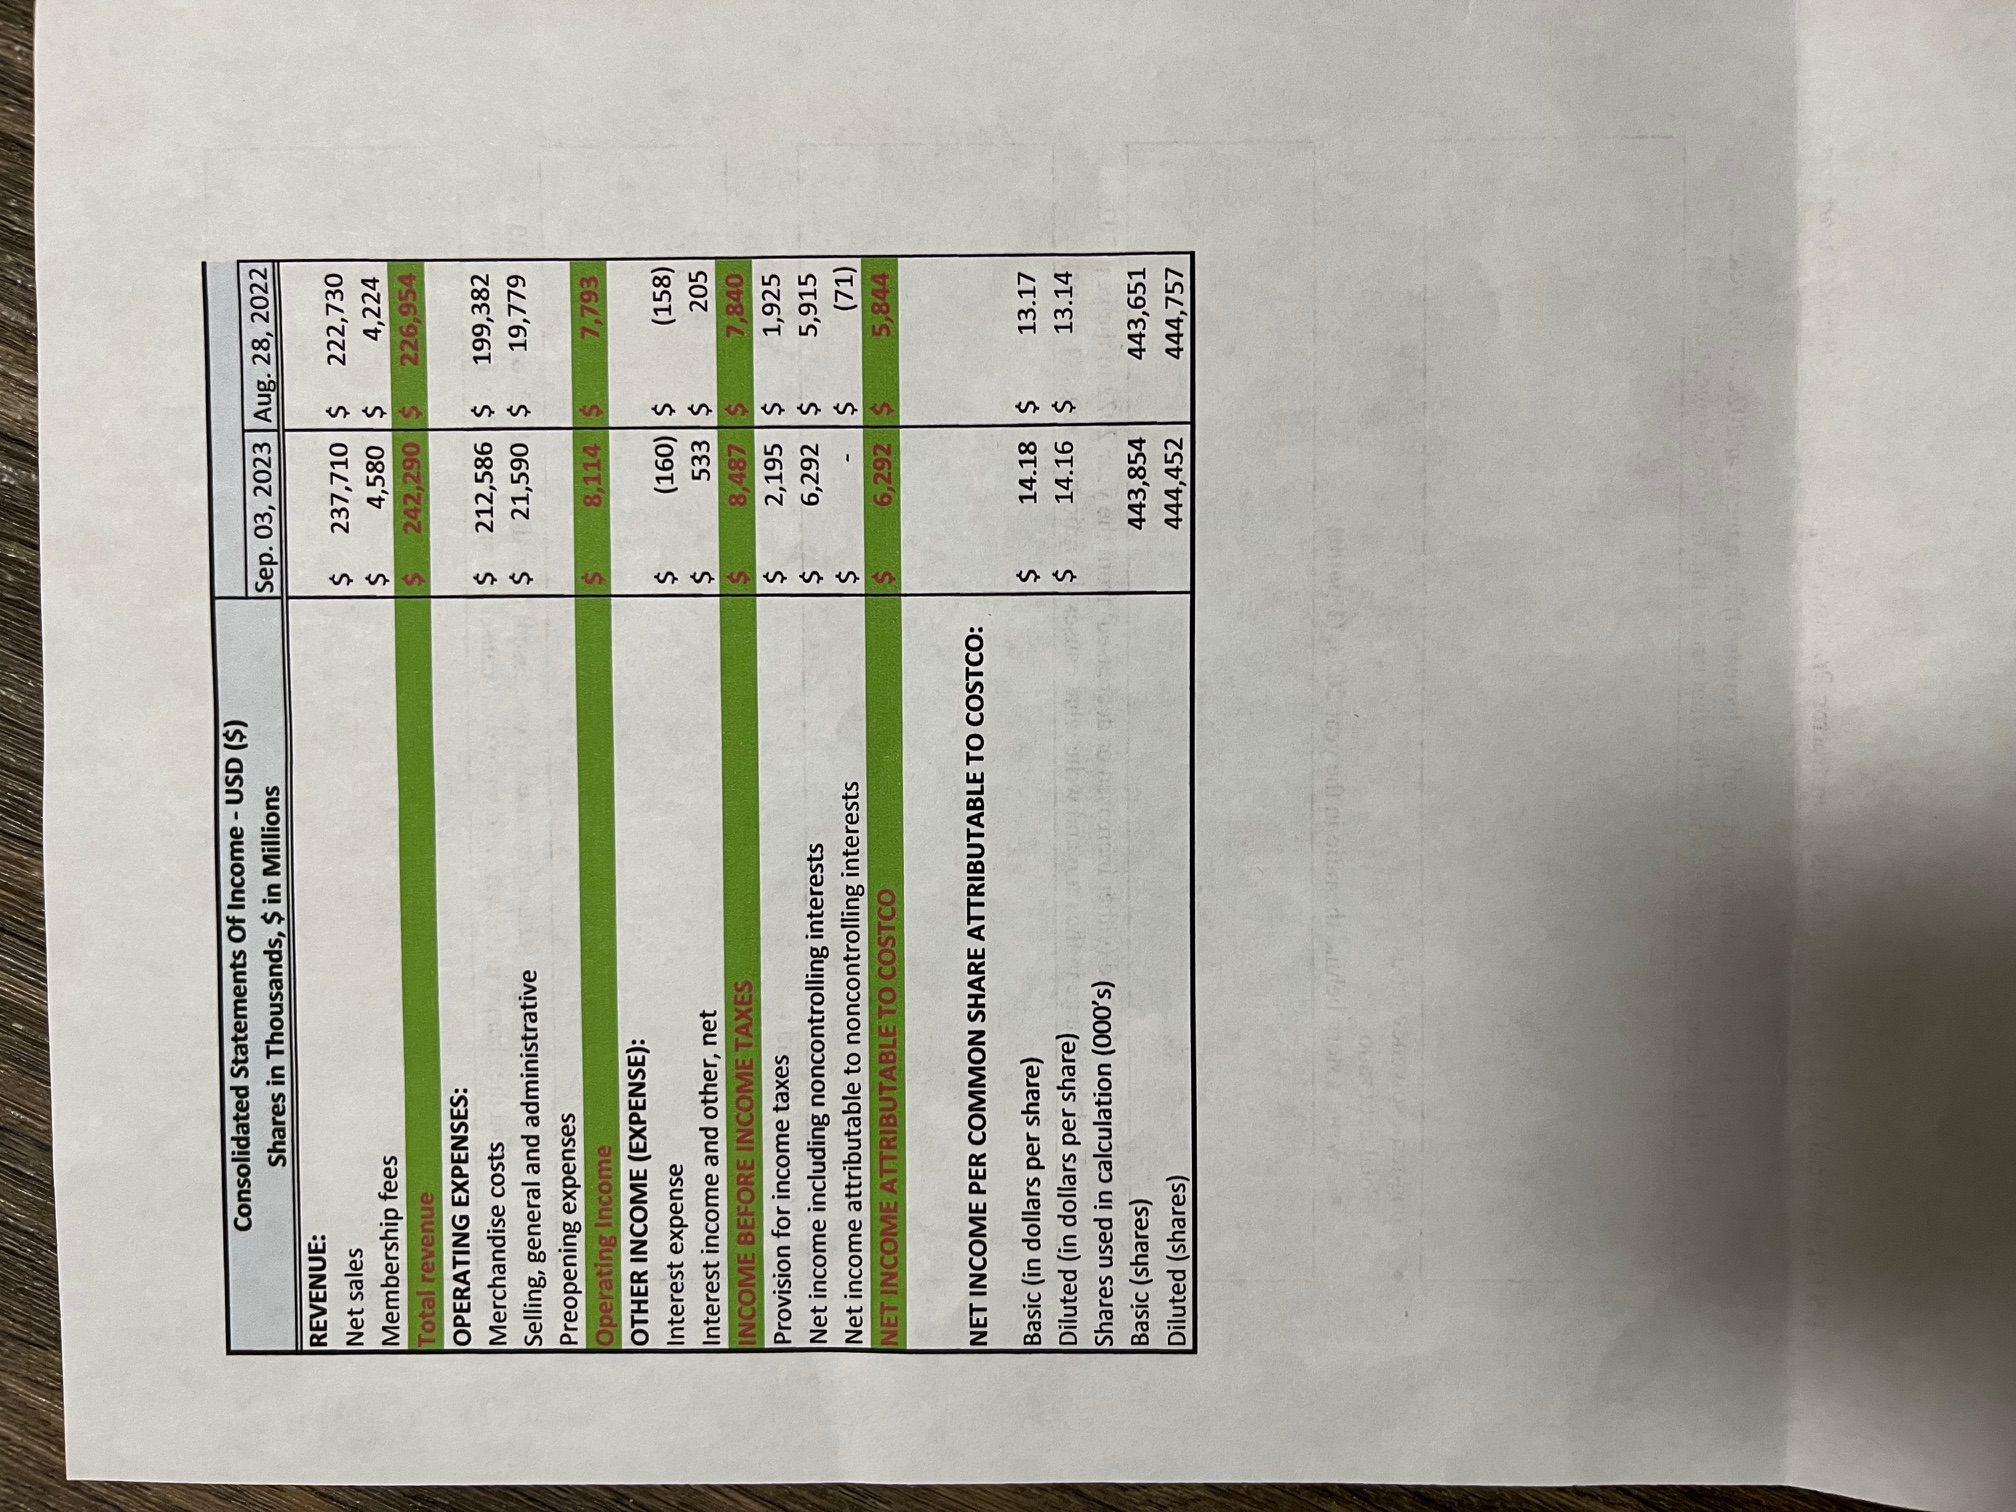
The ratio changed (either increased or decreased) from the year 2022 to the year 2023. Find the change in the ratio and write what causes the ratio to change. (1 point) O Accounts Receivables Turnover Write a story behind the ratio in the year 2023. (1 point) The ratio changed (either increased or decreased) from the year 2022 to the year 2023. Find the change in the ratio and write what causes the ratio to change. (1 point) o Total asset turnover Write a story behind the ratio in the year 2023. (1 point) Profitability ratios o Profit margin Write a story behind the ratio in the year 2023. (1 point) 7 Consolidated Statements Of Cash Flows $ in Millions 12 Month Sep. 03, 2023 Aug. 28, 2022 Aug. 29, 2021 Aug. 30, 2020 CASH FLOWS FROM OPERATING ACTIVITIES Net income including noncontrolling interests $ 6,292 $ 5,915 $ 5,079 $ 4,059 Adjustments to reconcile net income including noncontrolling interests to net cash provided by operating activities: Depreciation and amortization $ Non-cash lease expense $ Stock-based compensation $ sss 2,077 $ 1,900 $ 1,781 $ 1,645 412 $ 377 $ 286 $ 194 774 $ 724 $ 665 $ 619 Other non-cash operating activities, net $ 76 $ 85 $ 42 Deferred income taxes $ 495 $ (37) $ 59 $ 104 Tax withholdings on stock-based awards Changes in operating assets and liabilities: Merchandise inventories Accounts payable Other operating assets and liabilities, net Net cash provided by operating activities CASH FLOWS FROM INVESTING ACTIVITIES Purchases of short-term investments Maturities and sales of short-term investments Additions to property and equipment Acquisitions Other investing activities, net Net cash used in investing activities CASH FLOWS FROM FINANCING ACTIVITIES Change in bank checks outstanding Repayments of short-term borrowings Proceeds from short-term borrowings Proceeds from issuance of long-term debt Repayments of long-term debt Repurchases of common stock Cash dividend payments $ 1,228 $ (4,003) $ (1,892) $ (791) $ (382) $ 1,891 $ 1,838 $ 2,261 $ 172 $ 549 $ 1,057 $ 728 $ 11,068 $ 7,392 $ 8,958 $ 8,861 $ (1,622) $ (1,121) $ (1,331) $ (1,626) $ 937 $ 1,145 $ 1,446 $ 1,678 $ (4,323) $ (3,891) $ (3,588) $ (2,810) $ (1,163) $ 36 $ (48) $ (62) $ 30 (4,972) $ (3,915) $ (3,535) $ (3,891) $ $ $ $ $ sssssssss $ $ $ $ 137 (935) $ (6) 917 $ 53 13 $ $ $ $ $ 3,992 (75) $ (800) $ (94) $ (3,200) (303) $ (363) $ (312) $ (330) (676) $ (439) $ (496) $ (196) (1,251) $ (1,498) $ (5,748) $ (1,479)| Dividend to noncontrolling interest Acquisition of noncontrolling interest $ Financing lease payments $ Other financing activities, net SSSS $ (208) $ $ $ $ (842) $ (291) $ (176) $ $ $ $ Net cash (used in) provided by financing activities (2,614) $ (4) $ (4,283) $ 162 $ 4555 (71) (6,488) $ (1,147) EFFECT OF EXCHANGE RATE CHANGES ON CASH AND CASH EQUIVALENTS $ Net change in cash and cash equivalents $ 15 $ 3,497 $ (249) $ (1,055) $ CASH AND CASH EQUIVALENTS BEGINNING OF YEAR $ CASH AND CASH EQUIVALENTS END OF YEAR 10,203 $ 13,700 $ 11,258 $ 10,203 $ 46 $ (1,019) $ 12,277 $ 11,258 $ 70 3,893 8,384 12,277 SUPPLEMENTAL DISCLOSURE OF CASH FLOW INFORMATION: Cash paid during the year for:: Interest Income taxes, net $ SS 125 $ $ 2,234 $ 145 $ 1,940 $ 149 $ 1,527 $ 124 1,052 REVENUE: Net sales Consolidated Statements Of Income - USD ($) Shares in Thousands, $ in Millions Membership fees Total revenue OPERATING EXPENSES: Merchandise costs Selling, general and administrative Preopening expenses Operating Income OTHER INCOME (EXPENSE): Interest expense Interest income and other, net INCOME BEFORE INCOME TAXES Provision for income taxes Net income including noncontrolling interests Net income attributable to noncontrolling interests NET INCOME ATTRIBUTABLE TO COSTCO NET INCOME PER COMMON SHARE ATTRIBUTABLE TO COSTCO: Basic (in dollars per share) Diluted (in dollars per share) Shares used in calculation (000's) Basic (shares) Diluted (shares) Sep. 03, 2023 Aug. 28, 2022 $ 237,710 $ 222,730 $ 4,580 $ 4,224 $ 242,290 $ 226,954 $ 55 $ 212,586 $ 199,382 21,590 $ 19,779 8,114 $ 7,793 $ (160) $ (158) $ 533 $ 205 $ 8,487 $ 7,840 SSS 2,195 $ 1,925 $ 6,292 $ 5,915 $ (71) 6,292 $ 5,844 $ 14.18 $ 13.17 $ 14.16 $ 13.14 443,854 443,651 444,452 444,757 Date Market price per share of common stock (=Adjusted Close price per share) Shares outstanding of common stock 3-Oct-23 $478.30 $564.00 442,740,572 442,604,145 441,823,811 441,228,027 27-Sep-22 28-Sep-21 29-Sep-20 $444.46 $341.82
Step by Step Solution
There are 3 Steps involved in it
Step: 1
To analyze the financial ratios we need to calculate the relevant ratios for the years 2022 and 2023 and then determine the cause of any changes Here ...
Get Instant Access to Expert-Tailored Solutions
See step-by-step solutions with expert insights and AI powered tools for academic success
Step: 2

Step: 3

Ace Your Homework with AI
Get the answers you need in no time with our AI-driven, step-by-step assistance
Get Started


