

Answered step by step
Verified Expert Solution
Question
1 Approved Answer
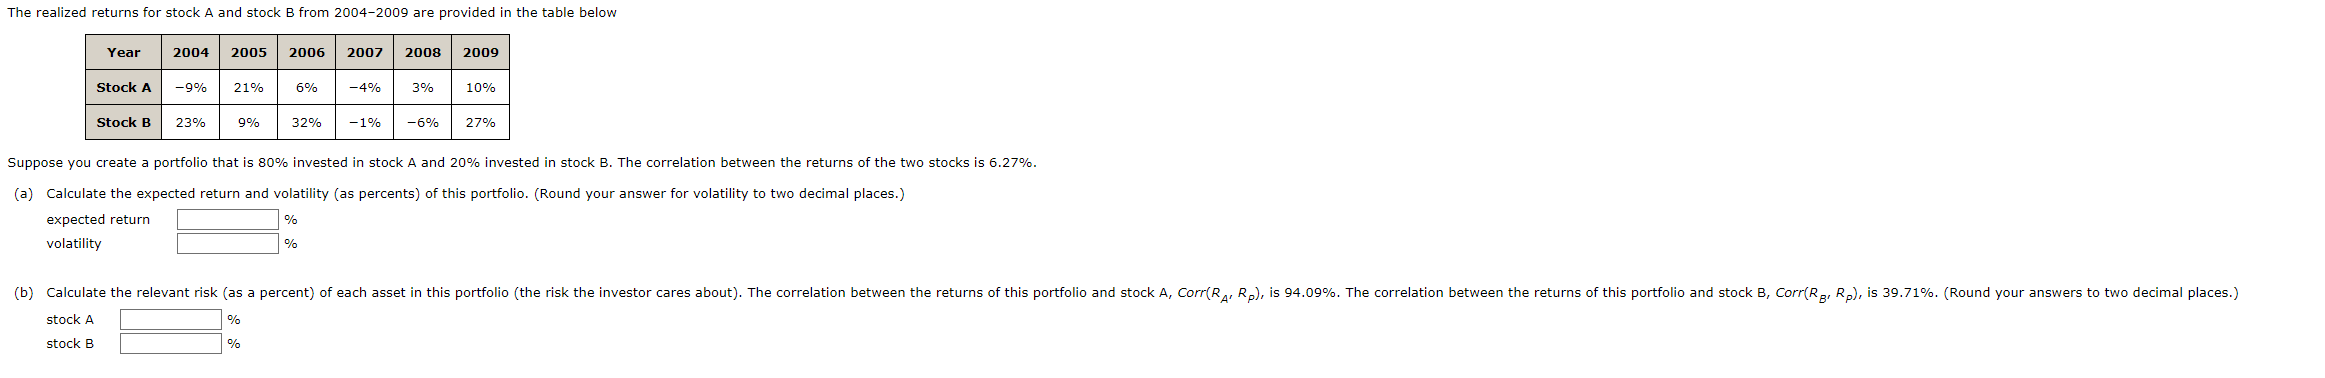
The realized returns for stock A and stock B from 2004-2009 are provided in the table below Year 2004 2005 2006 2007 2008 2009 Stock
Step by Step Solution
There are 3 Steps involved in it
Step: 1

Get Instant Access to Expert-Tailored Solutions
See step-by-step solutions with expert insights and AI powered tools for academic success
Step: 2

Step: 3
Ace Your Homework with AI
Get the answers you need in no time with our AI-driven, step-by-step assistance
Get Started
Standards Of Value
Authors: Jay E. Fishman, Shannon P. Pratt, William J. Morrison
2nd Edition
1118138538, 978-1118138533